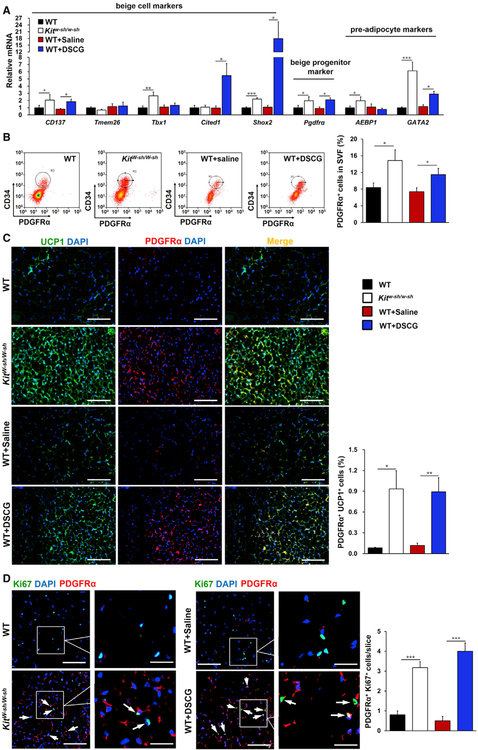
Figure 3. MCs Inhibited SAT PDGFRα+ Beige Progenitor Cell Proliferation and Browning.
(A) Real-time PCR analysis of beige cell markers, beige progenitor marker Pdgfrα, and pre-adipocyte markers in SAT from the indicated groups of mice (n = 8–13 per group).
(B) FACS analysis of PDGFRα+ cells in SAT (as defined by CD34+ PDGFRα+). n = 8~10 per group.
(C) Immunofluorescent double staining of PDGFRα+ (red) and UCP1+ (green) double-positive cells.
(D) Immunofluorescent double staining of PDGFRα+ (red) and Ki67+ (green) double-positive cells in SAT, with nuclei counterstained with DAPI (blue) (n = 8 per group).
Scale bars, 100 µm; inset scale bars, 25 µm. Representative images in (B)–(D) are shown on the left.
Data are mean ± SEM. *p < 0.05, **p < 0.01, ***p < 0.001.

