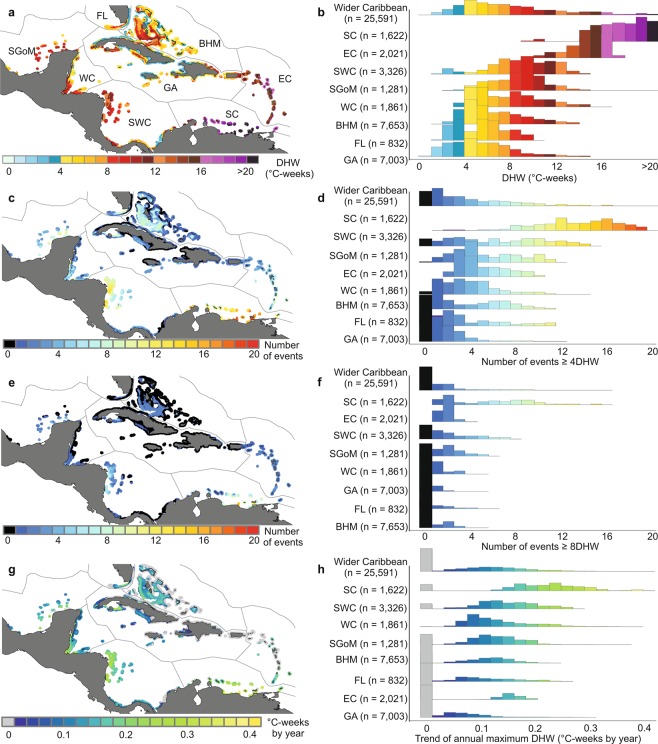
Figure 1.
Spatial variability of heat stress exposure indicators in the wider Caribbean region from 1985–2017. (a) Map showing heat stress values per pixel. (b) Histogram of the distribution of heat stress for ecoregions and the wider Caribbean in the entire time series. (c) Map and (d) histogram of bleaching risk events (≥ 4 °C-weeks). (e) Map and (f) histogram of mortality risk events (≥ 8 °C-weeks). (g) Map showing trend of annual maximum DHW obtained by a Generalized Least Squares model (GLS), considering a temporal autocorrelation; the grey pixels show non-significant trend coefficients (p-value > 0.05). (h) Histogram of the annual trend of maximum DHW. Histograms for the ecoregions are ordered by statistical significance supported by a pairwise post hoc comparison of the heteroscedastic one-way ANOVA test (Tables S5–S8). The total number of pixels (25,591) for the complete region represents an area of about 127,405 km2. The corresponding numbers of pixels included in each ecoregion are shown in parenthesis. Maps were created using QGIS version 3.2.0 (https://www.qgis.org/en/site/)73.

