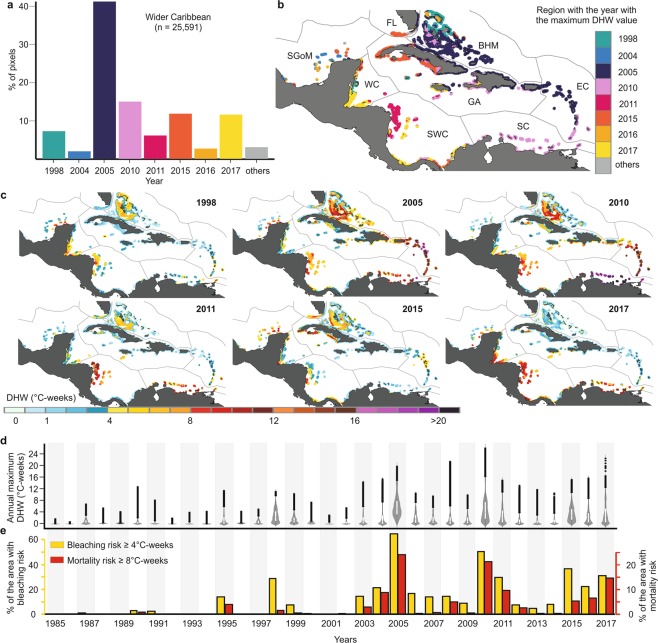
Figure 2.
Spatiotemporal summary of heat-stress events in the wider Caribbean basin during 1985–2017. (a) Percent of pixels with maximum DHW value in each year. (b) Year with maximum DHW value for the eight ecoregions. (c) Major heat-stress events. (d) Temporal distribution of annual maxima (interquartile range and median are represented with white box, outliers are represented with black points) and; (e) percentage of area with bleaching risk (≥ 4 °C-weeks) and mortality risk (≥ 8 °C-weeks). Maps of annual maximum DHW for the whole time series (1985–2017) can be found in the Supplementary Figs S1 and S2. Maps were created using QGIS version 3.2.0 (https://www.qgis.org/en/site/)73.

