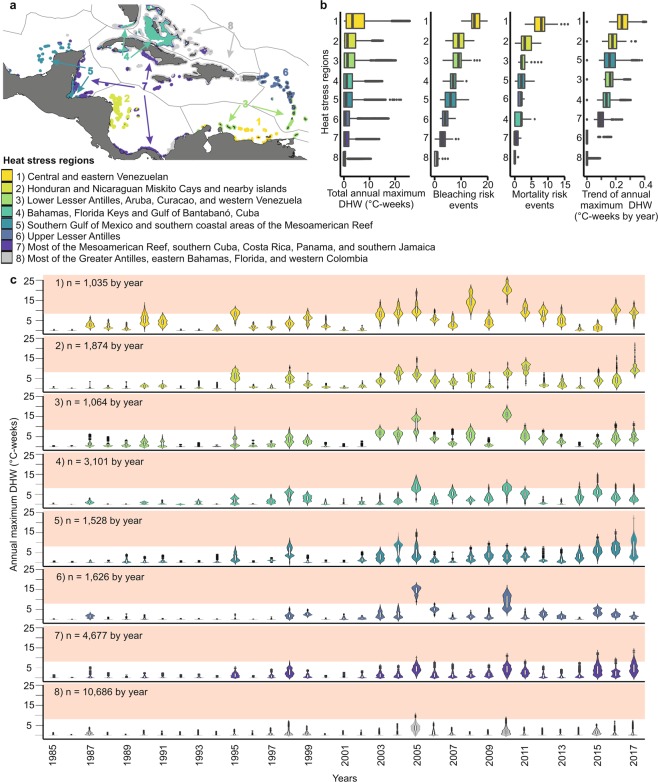
Figure 3.
Heat-stress regions and their maximum annual DHW during 1985–2017. (a) Reef locations within heat-stress regions 1–8 (clusters) outlined by ecoregions. (b) Total annual maximum Degree Heating Weeks (DHW), bleaching and mortality risk events and trends of annual maximum DHW. (c) Heat-stress regions 1–8 showing distribution of annual maxima, interquartile range and median are represented with white box, outliers are represented with black points. The pink shadow represents the limit of mortality risk (≥ 8 °C-weeks). Map was created using QGIS version 3.2.0 (https://www.qgis.org/en/site/)73.

