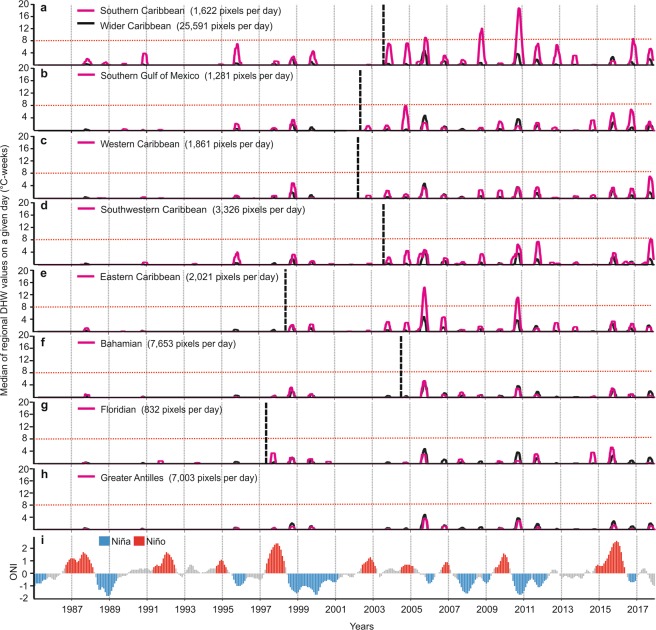
Figure 4.
Temporal patterns of Degree Heating Weeks (DHW) for ecoregions in the wider Caribbean and the ONI during years 1985 to 2017. For each ecoregion (a–h) the vertical dotted black line shows the change point analysis obtained via a Pettit test (Table S19), the horizontal dotted red line shows the limit of mortality risk (≥ 8 °C-weeks), the black curve shows the median of the wider Caribbean DHW values on a given day and the pink curve shows the median of the ecoregional DHW values on a given day. For ONI (i), red bars indicate El Niño phases, blue bars indicate La Niña phases, and grey bars show neutral phases.

