Figure 5.
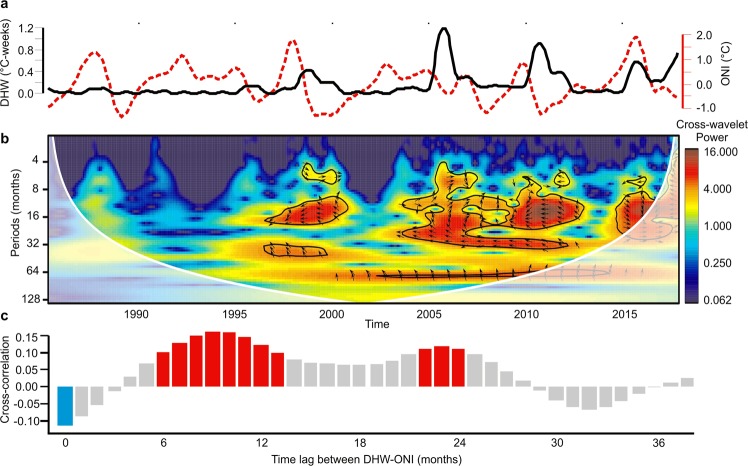
Wider Caribbean DHW temporal patterns and ENSO relationship. (a) 1.5 years smoothed mean of DHW (black line) and ONI (red line) time series. (b) Cross-wavelet showing the common power (color bar) and phases (arrows). Phases arrow direction represents decreases of ONI and increases in DHW (left); increase of ONI and increase in DHW (right). Black solid lines show the significance of cross-wavelet power at 95% confidence. The ‘cone of influence’ is represented by the white shadow; only results inside the cone of influence was ben considered and interpreted (outside the cone = high uncertainty). (c) cross-correlation between DHW-ONI at different time lags. Red bars represent significant positive correlation and blue bars represent significant negative correlation at 95% confidence.

