Fig. 4.
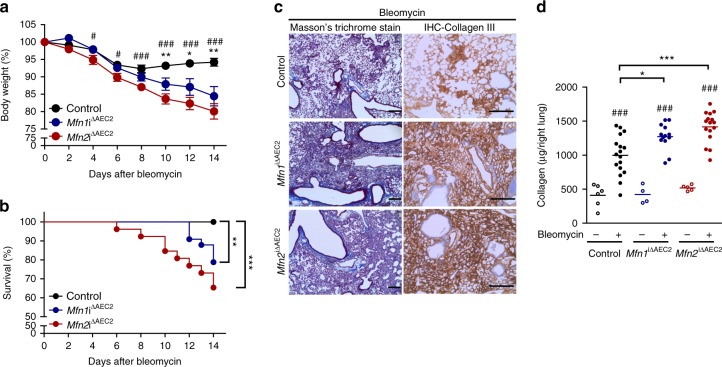
MFN1 or MFN2 deficiency in AEC2 cells promotes bleomycin-induced lung fibrosis. a Body weight changes of control (n = 18), Mfn1iΔAEC2 (n = 13) and Mfn2iΔAEC2 (n = 16) mice after bleomycin treatment. Data are mean±s.e.m. (results from 3 independent experiments; *Mfn1iΔAEC2 vs. control, #Mfn2iΔAEC2 vs. control; * and #, p < 0.05, ** and ##, p < 0.01, ###p < 0.001, by unpaired Student’s t test). b Kaplan–Meier survival curves of control (n = 32), Mfn1iΔAEC2 (n = 33) and Mfn2iΔAEC2 (n = 26) mice after bleomycin treatment (results from 3 independent experiments; **p < 0.01, ***p < 0.001, by log-rank test). c Masson’s trichrome staining (left panel, ×100 magnification, scale bar 200 μm) and IHC staining of collagen III (right panel, ×200 magnification, scale bar 200 μm) in lung sections of control, Mfn1iΔAEC2 and Mfn2iΔAEC2 mice14 days after bleomycin treatment (control mice n = 10, Mfn1iΔAEC2 mice n = 12, Mfn2iΔAEC2 mice n = 3). d Acid-soluble collagen levels in the right lung from control (PBS n = 6, bleomycin n = 17), Mfn1iΔAEC2 (PBS n = 4, bleomycin n = 13) and Mfn2iΔAEC2 (PBS n = 5, bleomycin n = 16) mice 14 days after PBS or bleomycin treatment, quantified by Sircol assay. The line indicates mean (#, bleomycin vs. PBS, * vs. control mice; *p < 0.05, *** and ###p < 0.001 by one-way ANOVA with post-hoc Bonferroni test). Source data (a, b, d) are provided as a Source Data file

