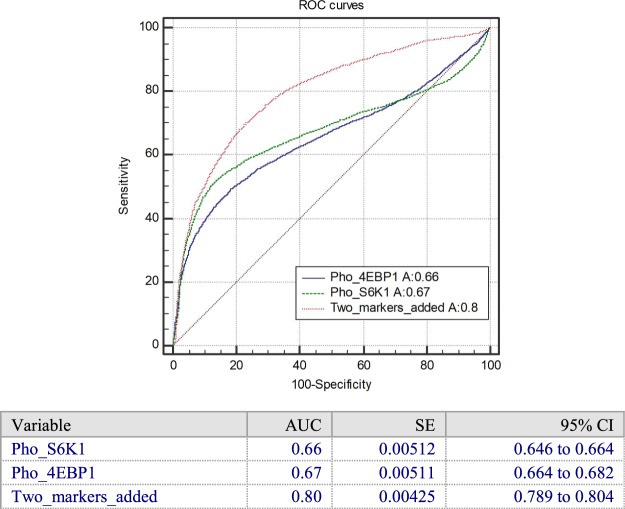
Figure 3.
The ROC curve with pho-S6K1, pho-4EBP1 and the two added markers for everolimus sensitive/resistant cells group without everolimus. The combined IF intensity has a higher AUC than pho-4EBP1 and pho-S6K1 individually and can distinguish sensitive and resistant cells group statistically. (Amount of cells used in the test: 11092 cells, including six types of cell lines and PDCC. The parameter of ROC curves likes AUC, SE and 95% CI are listed).

