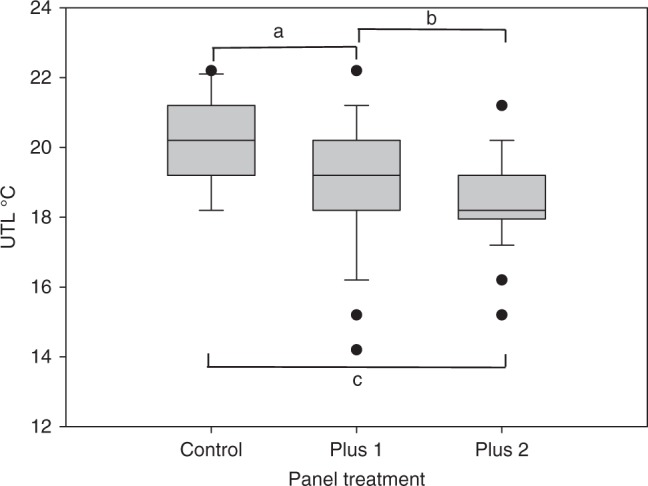
Fig. 2.

Box plot showing acute UTLs for the spirobid polychaete R. perrieri. Central line of each box denotes the median, the top and bottom edges of the box show the 25% and 75% percentile, with the 10% and 90% percentiles shown by the upper and lower whiskers; outliers are shown as circles. Letters denote statistically significant differences between treatments (a: P = 0.0129; b: P = 0.000; c: P = 0.0200) (Mann–Whitney pairwise comparisons). Source data are provided as a Source Data file
