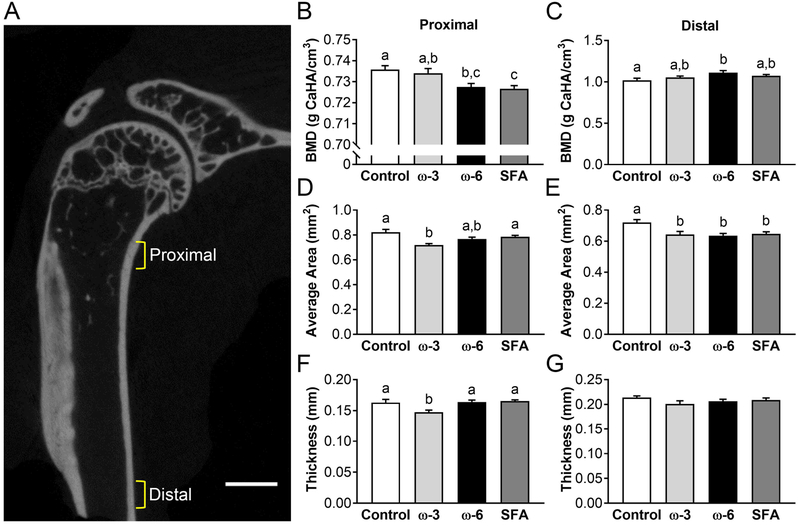
Figure 2: Cortical bone microCT results.
A) Brackets indicate two analyzed diaphyseal regions: proximal begins 0.5mm below the end of the humeral head and is 0.5mm thick, distal begins after the deltoid tuberosity and is 0.4mm thick. Scale bar: 1mm. Bone mineral density (BMD) for B) proximal and C) distal. Average cross-sectional area for D) proximal and E) distal. Cortical thickness for F) proximal and G) distal. Data presented as mean ± SEM. Groups not sharing the same letter are significantly different from one other, one-way ANOVA and Tukey’s post-hoc test, p<0.05.

