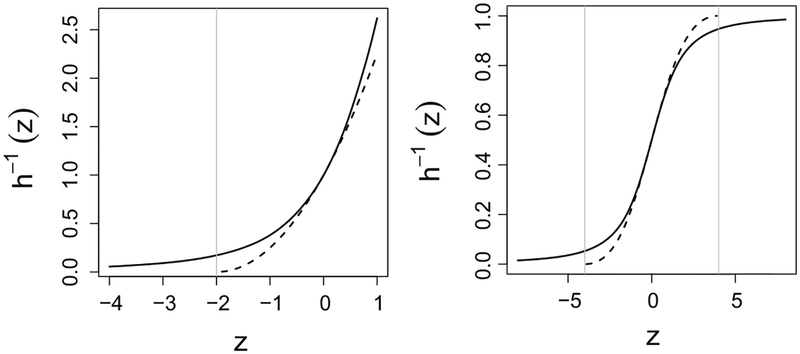
Figure 2.
Left plot: Inverse of the Proposal I transformation for a singly bounded variable (solid line) and Box–Cox transformation (dashed line). Right plot: Inverse of the Proposal I transformation for a doubly bounded variable (solid line) and Aranda-Ordaz transformation (dashed line). The range boundaries of the Box-Cox and Aranda-Ordaz transformations are marked by vertical grey lines.

