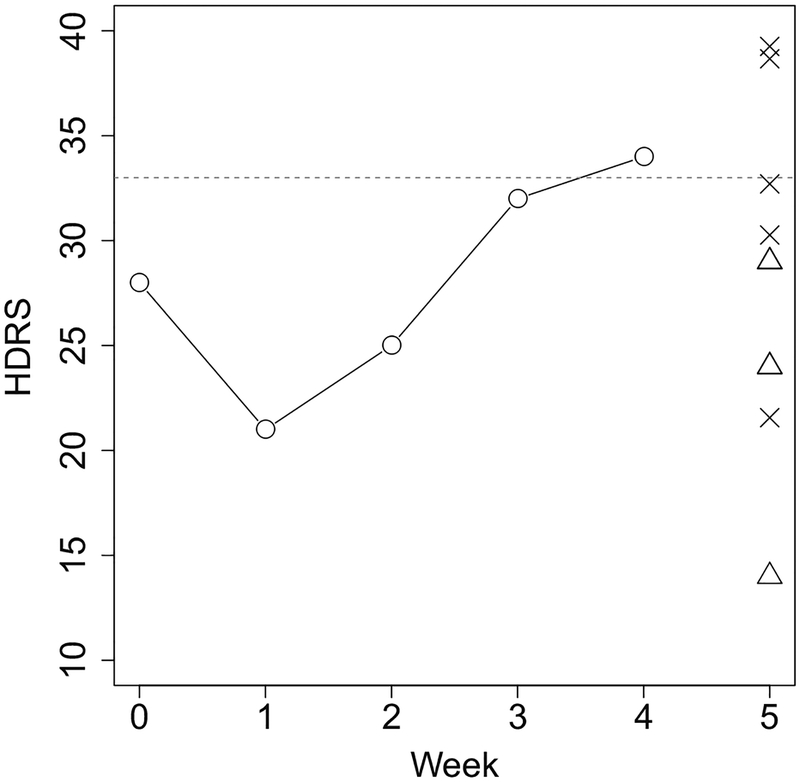
Figure 6.
Hamilton Depression Rating Scale (HDRS) scores for subject with ID 322 in the Reisby’s dataset. Circles represent observed values, while imputations from transformation-based quantile regression and predictive mean matching are marked with, respectively, crosses and triangles. The horizontal dashed line marks the upper bound of the scores for all subjects observed at week 5.

