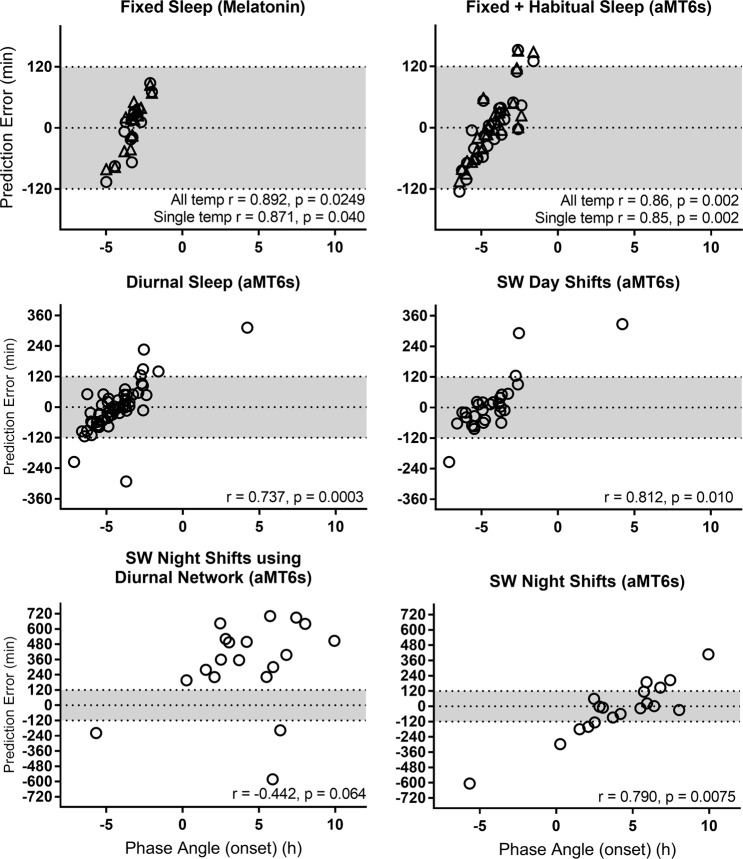
Figure 5.
Relationship between prediction error and phase angle of entrainment, calculated as the difference between reference circadian phase and average sleep onset for each dataset. Networks trained with 11 temperature sensors are represented in triangles, and with 1 temperature sensor in circles. Grey shading indicates a ±2 h error window. Negative phase angle indicates sleep onset occurred before melatonin/aMT6s acrophase; positive phase angle indicates sleep onset occurred after melatonin/aMT6s acrophase. Correlation coefficients were calculated using circular statistics.

