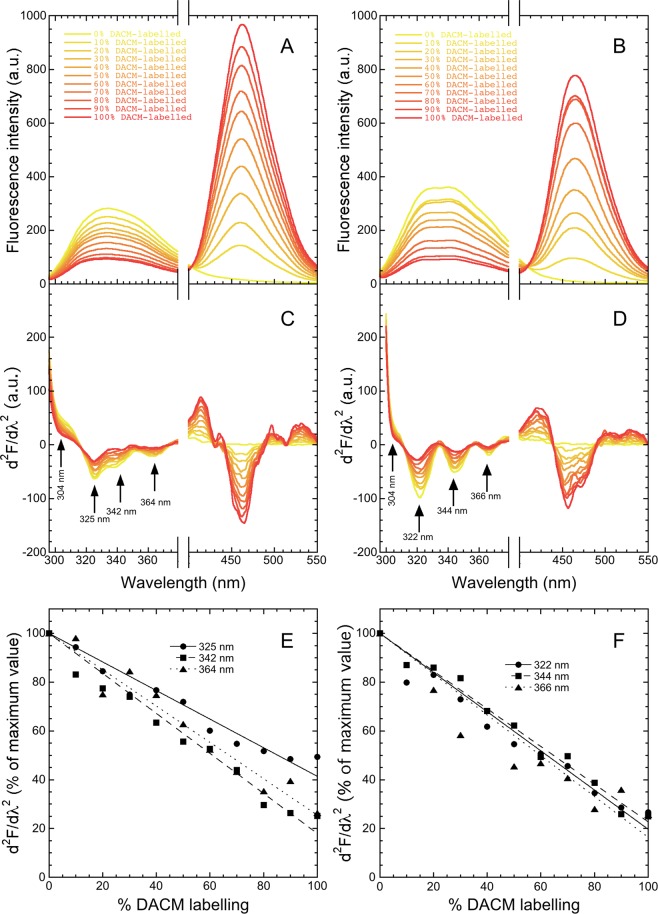
Figure 2.
Gross and second derivative fluorescence spectra of M-TTR and W79F M-TTR with various degrees of DACM-labelling. (A,B) Fluorescence spectra (excitation 290 nm, slits 2.5 and 5 nm for ex and em, respectively) of mixtures of M-TTR and DACM-M-TTR (A) or W79F M-TTR and W79F DACM-M-TTR (B) at the indicated percentages of the DACM-labelled protein, at 3 µM total protein concentration, in 20 mM phosphate buffer, pH 7.4, 25 °C. (C,D) Corresponding second derivative spectra for M-TTR (C) and W79F M-TTR (D) with arrows indicating the major peaks arising from tyrosine residues (304 nm) and tryptophan residues (320–370 nm). (E,F) Values of second derivative as a function of DACM-labelling percentage for the three indicated peaks of M-TTR (E) and W79F M-TTR. (F) To facilitate the comparison, all values were normalised attributing 100% to those determined with 0% labelling. The lines through the data represent the best fits to a linear function of the form d2F/dλ2 = 100% + a · (% DACM labelling).

