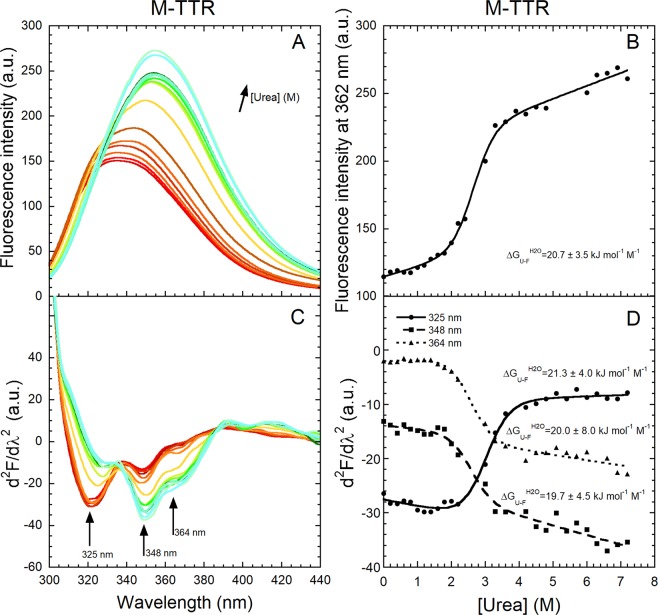
Figure 5.
Equilibrium urea unfolding of M-TTR. (A) Fluorescence spectra (excitation 290 nm, slits 5 and 10 nm for ex and em, respectively) at 60 µM protein concentration and urea concentrations ranging from 0 to 7.2 M in 20 mM phosphate buffer, at pH 7.4, 25 °C. (B) Urea denaturation curve using fluorescence intensity at 362 nm. The solid line through the data represents the best fit to a two-state model (Santoro and Bolen, 1988). The obtained value is shown. (C) Corresponding second derivative spectra with arrows indicating the major peaks. (D) Values of second derivative at 325, 348 and 364 nm versus urea concentration, plotted to obtain urea denaturation curves. The solid lines through the data represent the best fit to a two-state model (Santoro and Bolen, 1988). The obtained values are shown.

