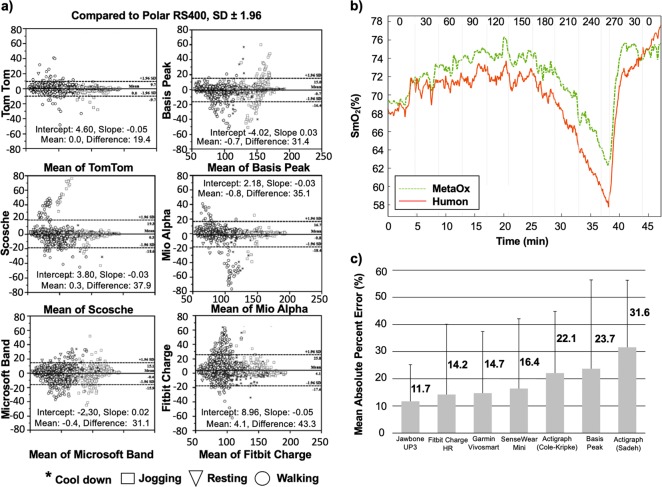
Fig. 4.
Wearable sensors monitor the physiological status (heart rate, muscle oxygen saturation, and sleep) of the athlete. a Bland Altman plots for all wearable wrist-sensors compared to the Polar RS400. x-axis: Mean of PolarRS400 and tested device; y-axis: PolarRS40 and tested device. b SmO2 results for a representative subject during an incremental cycling test. The Humon Beta SmO2 (red line) and MetaOx SmO2 (green line) absolute values are 3–5% different; however, the overall trend holds for the duration of the exercise. The vertical lines indicate the time point that the power on the bike was changed and the numbers on top of the graph represent the power level (Watts) at which the subject was cycling. c Mean absolute percent error for various wearable devices during total sleep time. The numbers denoted next to each bar represent the mean absolute percentage error values which were used to calculate the absolute difference between each monitor and the sleep diary values. Figures were reproduced with permission from Stahl et al.102 a, Farzam et al.117 b, and Lee et al.131 c

