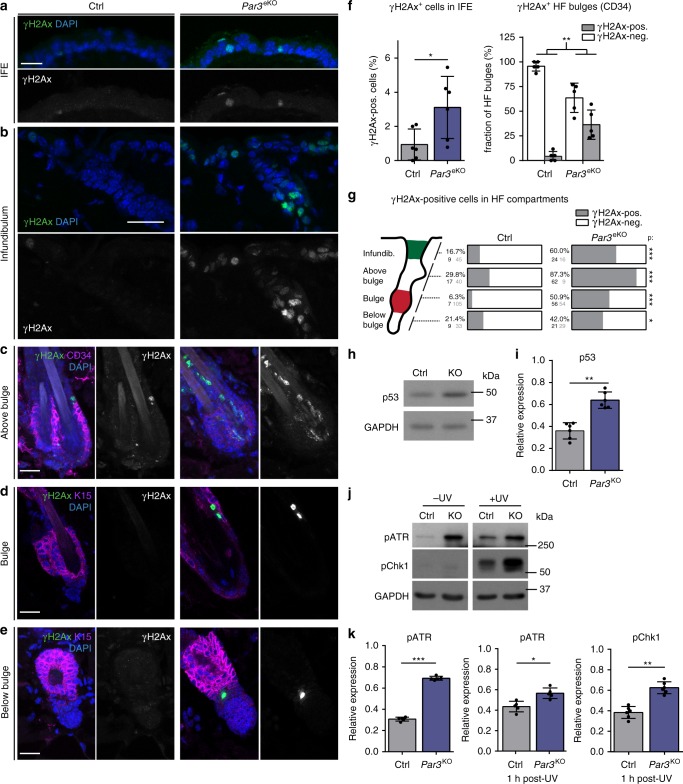
Fig. 1.
Epidermal Par3 loss leads to increased DNA damage and ectopic activation of DNA damage responses. a–e Maximum projection of back-skin cross sections from P100 old epidermal Par3A knockout (Par3eKO: K14Cre/+;Par3fl/fl) and control mice (K14Cre/+) stained for γH2Ax and Keratin15 or CD34. Micrographs show (a) the interfollicular epidermis (IFE), Scale bar: 15 µm (b) infundibulum, (c) isthmus and junctional zone (above bulge), (d) bulge, (e) secondary hair germ, bulb, and dermal papilla (below bulge). Scale bars: 20 µm. f Quantification of γH2Ax-positive cells in the IFE, and percentage of HF bulges (labeled by CD34) with cells positive for γH2Ax. n(IFE) = 6 mice, *p = 0.0250, mean ± SD, paired two-tailed Student’s t-test; n(HF) = 5 mice; **p = 0.0018; mean ± SD, two-way ANOVA/Sidak’s multiple comparison). g Quantification and graphical illustration of γH2Ax-positive cells in different HF compartments that were distinguished based on bulge marker expression and histological hallmarks (as shown in a–e): Data represent pooled numbers of positive cells from five individual animals per genotype. Total numbers of γH2Ax-positive (dark gray) and γH2Ax-negative compartments (light gray) per genotype are shown. *p = 0.0455, ***p < 0.0001; two-sided Fisher’s exact test (2 × 2 contingency table). h Immunoblot for p53 in whole cell keratinocyte lysates. GAPDH served as loading control. i Quantification of h. p53 levels were normalized to GAPDH and then expressed as relative values. n = 6 independent experiments, paired two-tailed Student’s t-test, **p = 0.0058, mean ± SD. j Immunoblot analysis of pATR and pChk1 in keratinocytes either non-treated or UV-B-treated (100 mJ/cm2). GAPDH served as loading control. k Quantification of j. pATR levels were normalized to GAPDH and then expressed as relative values. pChk1 levels were normalized to Chk1 and then expressed as relative values. n(pATR no UV, 1 h post-UV) = 5 independent experiments; n(pChk1 1 h post-UV) = 6 independent experiments, paired two-tailed Student’s t-test, *p = 0.0478, **p = 0.0038, ***p < 0.0001; mean ± SD. Cropped immunoblot data are shown. Image intensity was enhanced for better visualization. HF hair follicle, Ctrl control, KO Par3KO, IFE interfollicular epidermis, infund. infundibulum, neg negative, pos positive

