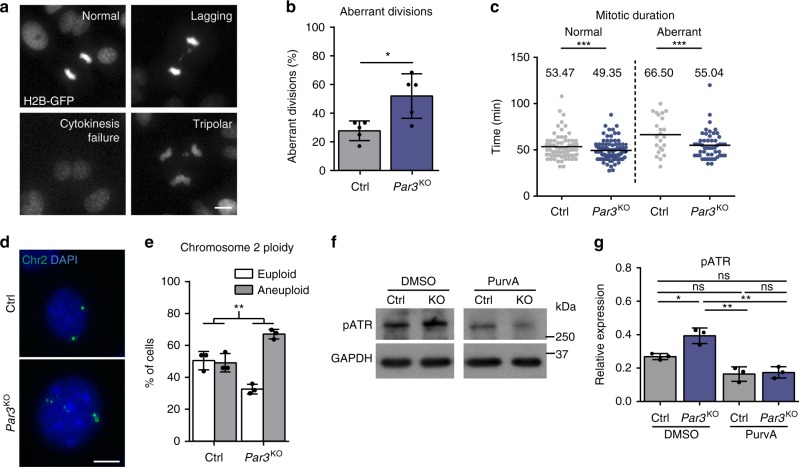
Fig. 2.
Par3 ensures mitotic fidelity and genome integrity of keratinocytes. a Representative images of mitotic aberrations observed in time-lapse microscopy of H2B-GFP-expressing keratinocytes (H2B-GFP in gray). Scale bar: 10 µm. b Quantification of aberrant cell divisions in primary Par3KO and control keratinocytes observed in time-lapse microscopy. n = 5 independent experiments, paired two-tailed Student’s t-test, *p = 0.0438, mean ± SD. c Quantification of mitotic duration (Ctrl/normal n = 69 cells, Par3KO/normal n = 95 cells, Ctrl/aberrant n = 23 cells, Par3KO/abnormal n = 51 cells; in all cases pooled from three independent experiments). For statistical analysis a nonlinear mixed model using RStudio software was employed, yielding ***p < 0.001. Bar represents mean. d Representative images of iFISH probes targeting chromosome 2. Scale bar: 10 µm. e Quantification of d. n = 3 independent experiments, **p = 0.0028, mean ± SD; two-way ANOVA/Sidak’s multiple comparisons test. f Immunoblot analysis of ATR activation in primary Par3-deficient and control keratinocytes after treatment with Cdk1 inhibitor Purvalanol A (10 µM). GAPDH served as loading control. g Quantification of f. pATR levels were first normalized to GAPDH and then expressed as relative values. n = 3 independent experiments; mean ± SD; two-way ANOVA/Tukey’s multiple comparisons test *p = 0.0459, **p = 0.0026 (Par3KO/DMSO vs. Ctrl/PurvA), **p = 0.0032 (Par3KO/DMSO vs. Par3KO/PurvA). Cropped immunoblot data are shown. iFISH interphase fluorescence in situ hybridization, Ctrl control, KO Par3KO, PurvA Purvalanol A, ns non-significant

