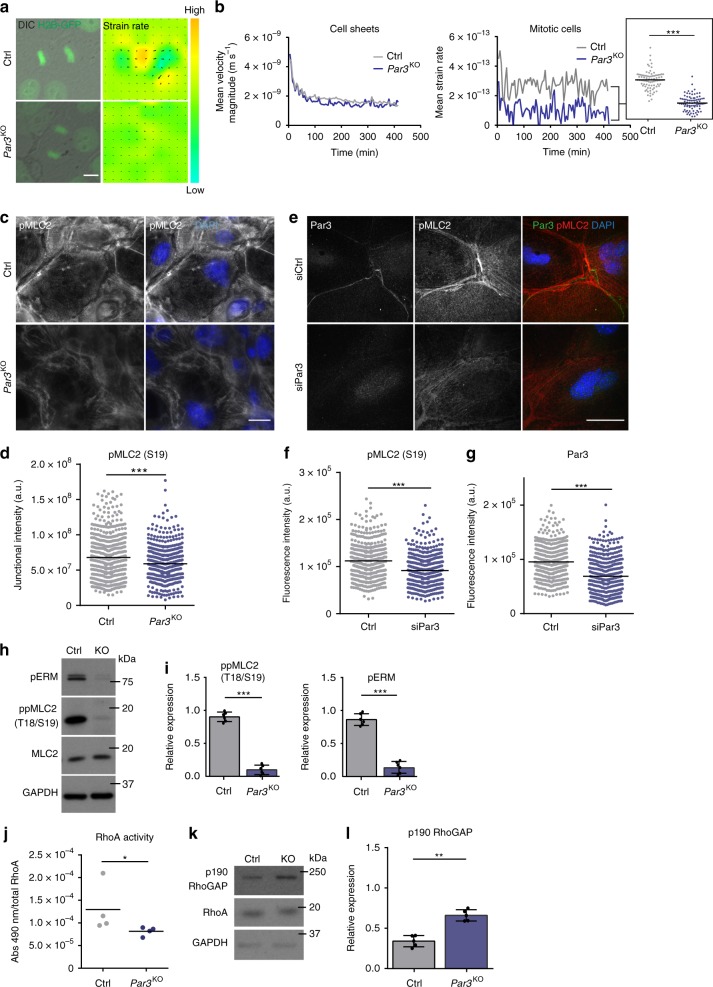
Fig. 3.
Par3 safeguards keratinocyte dynamics, and promotes RhoA activity and actomyosin contractility. a Snapshots from live cell-imaging videos monitoring H2B-GFP (green) fluorescence and DIC, smoothened strain rate maps from particle image velocimetry analyses (physics look-up table) and pseudo-color scale. Scale bar: 10 µm. b Quantification of mean velocity magnitude (n = 3 independent experiments) and mean strain rate over time (n = 30 mitotic cells pooled from three experiments). Dot plot (right panel) shows overall mean strain rate, Mann–Whitney U-test, ***p < 0.0001 (mitotic cells), mean. c Immunofluorescence micrographs of MLC2 phosphorylation (Ser19) (gray) in primary murine keratinocytes. DAPI is shown in blue. Scale bar: 25 µm. d Quantification of pMLC2 (Ser19) immunoreactivity at cell–cell junctions, intensity in arbitrary units; n(Ctrl) = 526 cells, n(Par3KO) = 519 cells pooled from three independent experiments; ***p = 0.0002, two-sided Mann–Whitney U-test, bar represents mean. e Immunofluorescence micrographs of control keratinocytes transfected with siCtrl or siPar3 and stained for Par3 (green) and pMLC2 (red). DAPI is shown in blue. Individual channels are displayed in gray. Scale bar: 40 µm. f, g Quantification of pMLC2 f and Par3 g immunoreactivity at cell–cell junctions, intensity in arbitrary units; n = 450 cells pooled from five independent experiments; ***p < 0.0001, two-sided Mann–Whitney U-test, bar represents mean. h Immunoblot analysis of ppMLC2 (Thr18/Ser19) and pERM in whole cell keratinocyte lysates. Total MLC2 and GAPDH served as loading control, respectively. i Quantification of h. ppMLC2 (Thr18/Ser19) levels were normalized to total MLC and then expressed as relative values. n = 6 biologically independent samples, paired two-tailed Student’s t-test, ***p < 0.0001, mean ± SD. pERM levels were first normalized to GAPDH and then expressed as relative values. n = 6 biologically independent samples, paired two-tailed Student’s t-test, ***p = 0.0002, mean ± SD. j Quantification of RhoA G-LISA® activation assay from keratinocyte lysates. Absorbance was normalized to total RhoA level determined by western blot. n = 4 biologically independent samples, Mann–Whitney U-test, *p = 0.0286, mean. k Immunoblot analysis of p190-RhoGAP. GAPDH was used as loading control. l Quantification of k, p190-RhoGAP levels were first normalized to RhoA and then expressed as relative values. n = 5 biologically independent samples, paired two-tailed Student’s t-test, **p = 0.0068, mean ± SD. Cropped immunoblot data are shown. Ctrl control, KO Par3KO, abs absorbance, DIC differential interference contrast

