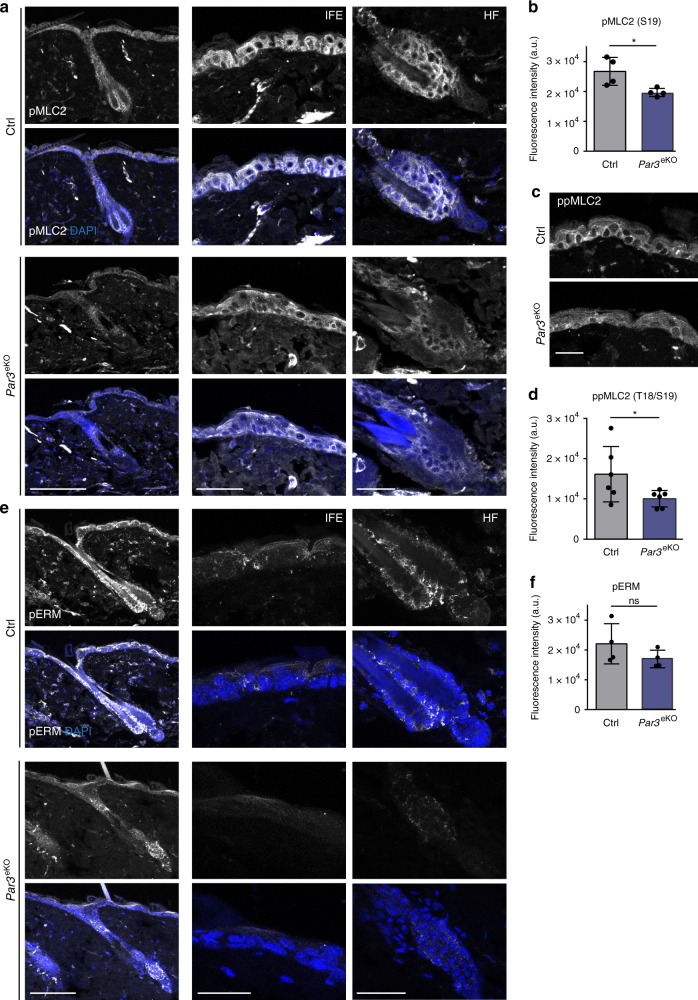
Fig. 4.
Reduced phosphorylation of MLC2 and ERM in Par3eKO mice. a Immunohistochemistry of P100 murine back-skin paraffin cross-sections stained for pMLC2 (Ser19) (gray). Left panels: overview micrographs (×20 objective, scale bar: 100 µm). Middle and right panel: higher magnification micrographs referring to signals within the IFE (middle panel) and HF (right panel). ×40 objective, scale bar: 40 µm (IFE), 20 µm (HF). b Quantification of pMLC immunoreactivity a. Intensity in arbitrary units. n = 4 mice, Mann–Whitney U-test, *p = 0.0286, mean ± SD. c Immunohistochemistry of P100 murine back-skin paraffin cross-sections stained for ppMLC2 (Thr18/Ser19) (gray) (Cell Signaling Technologies #3674). ×63 objective, scale bar: 20 µm. d Quantification of ppMLC immunoreactivity c. Intensity in arbitrary units, n = 6 mice, Mann–Whitney U-test, *p = 0.0411, mean ± SD. e Immunohistochemistry of P100 murine back-skin paraffin cross-sections stained for pERM (gray). Left panels: overview micrographs (×20 objective, scale bar: 100 µm). Middle and right panel: higher magnification micrographs referring to signals within the IFE (middle panel) and HF (right panel). ×63 objective, scale bar: 20 µm (IFE and HF). Image intensity was enhanced for better visualization (×63). f Quantification of pERM immunoreactivity e. Intensity in arbitrary units. n = 4 mice, Mann–Whitney U-test, mean ± SD. In all micrographs DAPI is shown in blue. Ctrl control, IFE interfollicular epidermis, HF hair follicle, ns non-significant

