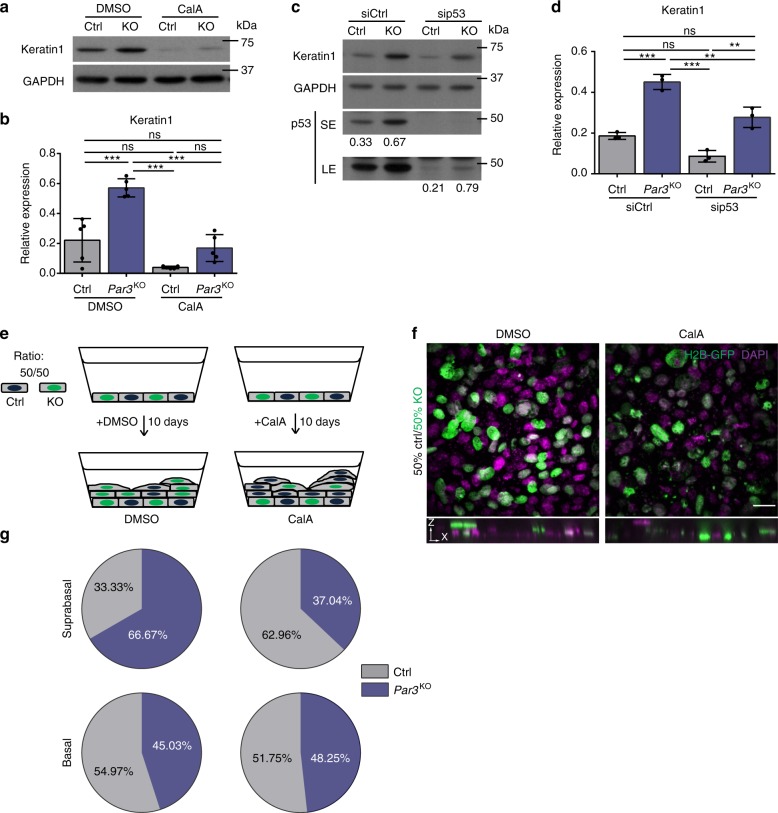
Fig. 7.
Reduced actomyosin contractility following Par3 loss drives ectopic differentiation and suprabasal fate. a Immunoblot analysis for Keratin1 expression in keratinocyte lysates following 48 h CalA (1 nM) treatment. GAPDH served as loading control. b Quantification of a. Keratin1 levels were first normalized to GAPDH and then expressed as relative values. n = 5 biological independent samples; ***p = 0.001 (Ctrl vs. Par3KO, DMSO-treated); ***p = 0.0003 (Par3KO, DMSO-treated vs. CalA-treated), ***p < 0.0001 (Par3KO/DMSO-treated vs. Ctrl/CalA-treated), mean ± SD, two-way ANOVA/Tukey’s multiple comparisons test. c Immunoblot analysis for Keratin1 expression in keratinocyte lysates following siCtrl or sip53 transfection. GAPDH served as loading control. Relative p53 protein levels are shown below the immunoblot. d Quantification of c. Keratin1 levels were first normalized to GAPDH and then expressed as relative values. n = 3; ***p = 0.0009 (Ctrl vs. Par3KO, siCtrl-treated); ***p = 0.0001 (Par3KO siCtrl-treated vs. Ctrl sip53-treated); **p = 0.008 (Par3KO siCtrl-treated vs. sip53-treated); **p = 0.0049 (Ctrl sip53-treated vs. Par3KO sip53-treated); mean ± SD; two-way ANOVA/Tukey’s multiple comparisons test. e Schematic representation of the Transwell filter culture system and experimental setup. Par3KO keratinocytes were positive for H2B-GFP, control keratinocytes isolated from littermates were negative for H2B-GFP. f Immunofluorescence micrographs of stratified cultures incubated for 10 days either in DMSO or in 1 nM CalA. Par3KO keratinocytes were H2B-GFP (green) labeled, DAPI is shown in magenta. Bottom panels show zx-projection. Scale bar: 50 µm. g Pie graphs showing cell distribution according to basal or suprabasal position following a 10-day culture period of mixed control and Par3KO keratinocyte cultures on Transwell filters. DMSO-treated samples: n = 180 cells (basal/DMSO-treated: n = 171 cells; suprabasal/DMSO-treated: n = 9 cells); CalA-treated samples: n = 170 cells (basal/CalA-treated: n = 143 cells; suprabasal/CalA-treated: n = 27 cells). An experimental representaton of three independent experiments is shown. Cropped immunoblot data are shown. Image intensity was enhanced for better visualization. Ctrl control, KO Par3KO, CalA Calyculin A, ns non-significant, SE short exposure, LE long exposure, siCtrl small interfering non-targeting RNAs, sip53 small interfering RNAs targeting p53

