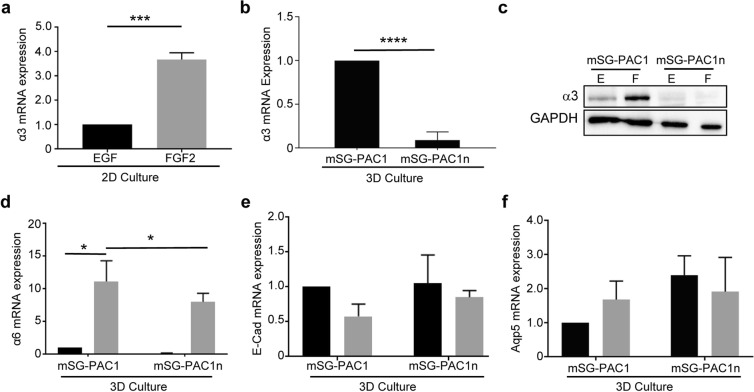
Figure 5.
Knockout of α3 integrins in mSG-PAC1 cells inhibits mRNA expression of α6 integrins, but not the expression of E-Cadherin or Aqp5 mRNA in response to FGF2. Cells were incubated in medium containing EGF (black bars) or FGF2 (gray bars) (a) Expression of α3 mRNA in mSG-PAC1 cells cultured on tissue culture plastic in the presence of EGF or FGF2 for five days. Expression was normalized to β-actin and then plotted ± s.e.m. as the fold change in FGF2 normalized to expression in EGF. Data are from three independent experiments analyzed by Student’s T-Test. ***p < 0.001. (b) Expression of α3 mRNA in mSG-PAC1 and mSG-PAC1n (α3-deleted) cells cultured in a Matrigel/collagen I matrix in the presence of EGF for five days. Expression of α3 was normalized to β-actin and then plotted ± s.e.m. as the fold decrease in mSG-PAC1n compared to mSG-PAC1 cells. Data are from three independent experiments analyzed by Student’s T-test. ***p < 0.001. (c) Representative western blot probed for the α3 subunit in mSG-PAC1 and mSG-PAC1n cells cultured on tissue culture plastic for four days. The image of the full-length blot is provided in Supplementary Fig. S6. (d) Expression of α6 mRNA in mSG-PAC1 and mSG-PAC1n cells cultured as in panel B in the presence of EGF or FGF2 for five days. Data are from three independent experiments analyzed by two-way ANOVA. p < 0.05. Tukey’s post-hoc analysis was performed to correct for multiple comparisons. (e,f) Expression of E cadherin mRNA and Aqp5 mRNA in mSG-PAC1 and mSG-PAC1n cells cultured as described in panel D. Data are from three independent experiments analyzed by two-way ANOVA. Differences are not significant.

