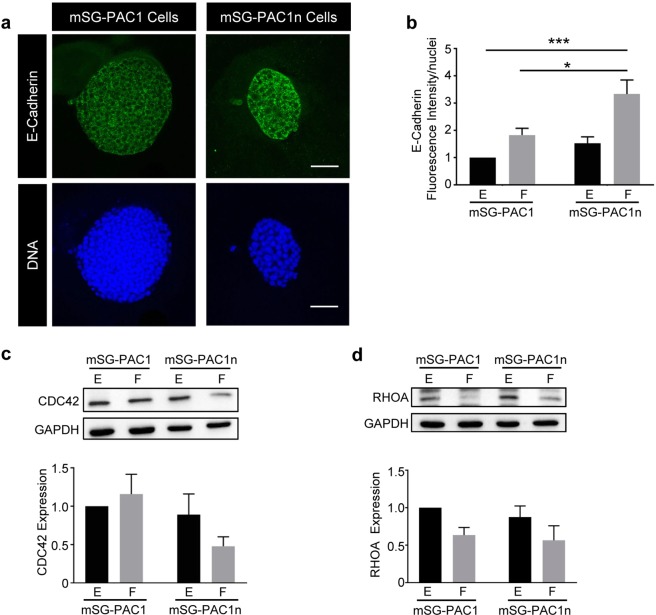
Figure 6.
Loss of Integrin α3 in pro-acinar cells results in changes in E-cadherin and CDC42. mSG-PAC1 and mSG-PAC1n cells were cultured in a Matrigel/collagen I matrix for five days in the presence of EGF or FGF2 and stained for E cadherin. (a) Representative confocal images of mSG-PAC1and mSG-PAC1n cells in a Matrigel/collagen I matrix cultured in the presence of FGF2 and stained for E cadherin. Images are maximum projections of five z-slices acquired at 40X, in 0.40 um steps. Images of spheres cultured in EGF are not shown as the expression of E-cadherin is extremely low. (b) Fluorescence intensity of E-cadherin expression was analyzed for all conditions and normalized to the number of nuclei per field from 15 spheres from three independent experiments. Data is plotted relative to the expression in mSG-PAC1 in EGF ± s.e.m. Data is analyzed by two-way ANOVA. p < 0.05–0.0001, as indicated. Tukey’s post-hoc analysis was performed to correct for multiple comparisons. (c,d) Representative western blots of (c) CDC42 and (d) RHOA expression by mSG-PAC1 and mSG-PAC1n cells cultured for four days on tissue culture plastic in the presence of EGF or FGF2. Images of full-length blots are provided in Supplementary Figs 6 and 7, respectively. Relative expression of (c) CDC42 and (d) RHOA was quantitated from three independent experiments using densitometry analysis and plotted as ± s.e.m as the fold change normalized to expression in mSG-PAC1 in EGF.

