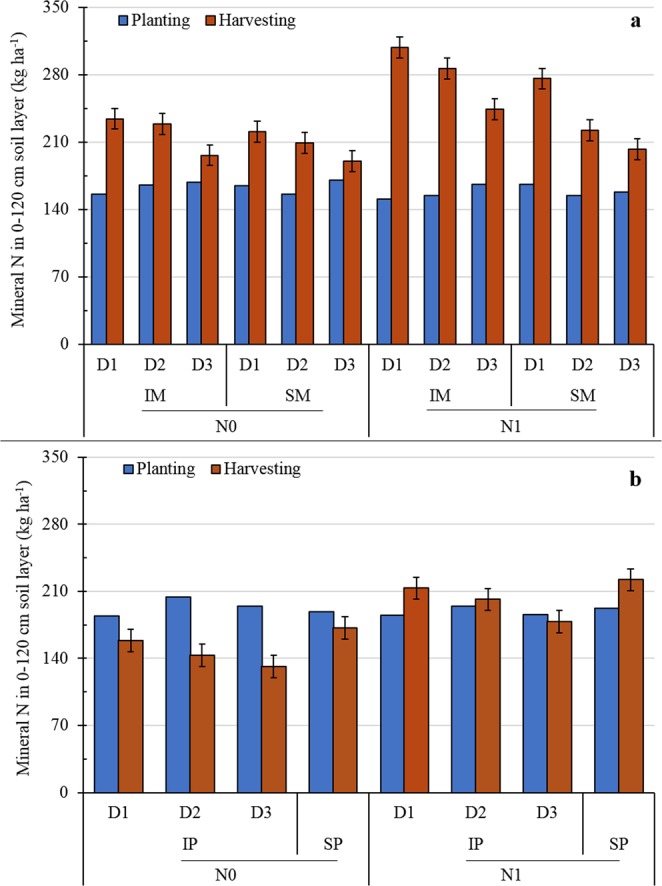
Figure 3.

Mineral nitrogen (N) (ammonium-N + nitrate-N) in the 0–120 cm soil layer of intercropped pea (IP) or sole pea (SP) (a) and intercropped maize (IM) or sole maize (SM) (b) with two N treatments (N0, 0 kg N ha−1; and N1, 225 kg N ha−1 for pea and 450 kg N ha−1 for maize) (b) and three maize densities in intercropping (D1, 73,600 plants ha−1; D2, 85,900 plants ha−1; and D3, 98,200 plants ha−1 for sole maize; the relative density of intercropped maize (according to the proportion of occupied area in intercropping) was 45,000, 52,500, and 60,000 plants ha−1 for D1, D2, and D3, respectively) (b,d). Error bars indicate standard errors of the means (n = 4).
