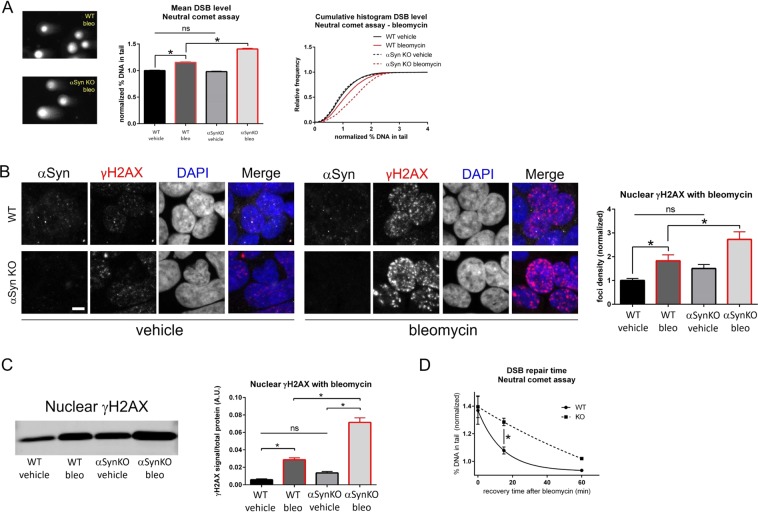
Figure 3.
Alpha-synuclein knock-out in HAP1 cells compromises DSB repair after bleomycin treatment. (A) Neutral comet assay after treatment with bleomycin (10μg/mL for 60 min) shows greater levels of DSBs in SNCA KO (αSyn KO) cells compared to WT. Left: Comet images, middle: group data (normalized % DNA in tail: WT vehicle = 1.00 ± 0.01 N = 4561 nuclei, WT bleo = 1.15 ± 0.01 N = 2269 nuclei, αSyn KO vehicle = 0.98 ± 0.01 N = 5182 nuclei, αSyn KO bleo = 1.41 ± 0.01 N = 2734 nuclei; F(3, 14742) = 394.83, p < 0.0001, ANOVA, post-hoc Tukey test: WT vehicle vs. WT bleo p < 0.0001, WT vehicle vs. αSyn KO vehicle p = 0.3487, WT vehicle vs. αSyn KO bleo p < 0.0001, WT bleo vs. αSyn KO vehicle p < 0.0001, WT bleo vs. αSyn KO bleo p < 0.0001, αSyn KO vehicle vs. αSyn KO bleo p < 0.0001, several significance lines have been left off the figure to improve clarity). Red outline on bars represents bleomycin treated conditions. Right: cumulative probability histogram showing differences in the distributions. (B) Bleomycin treatment (10μg/mL for 60 min) induces greater DSB levels in αSyn KO cells compared to WT, as measured by normalized nuclear γH2AX levels (normalized foci density): WT vehicle = 1.00 ± 0.08 N = 215 nuclei, WT bleo = 1.83 ± 0.25 N = 117 nuclei, αSyn KO vehicle = 1.51 ± 0.16 N = 159 nuclei, αSyn KO bleo = 2.73 ± 0.32 N = 117 nuclei; F(3, 604) = 14.564, p < 0.0001, ANOVA, post-hoc Tukey test: WT vehicle vs. WT bleo p = 0.0103, WT vehicle vs. αSyn KO vehicle p = 0.1570, WT vehicle vs. αSyn KO bleo p < 0.0001, WT bleo vs. αSyn KO vehicle p = 0.6621, WT bleo vs. αSyn KO bleo p = 0.0159, αSyn KO vehicle vs. αSyn KO bleo p < 0.0001. Several significance lines have been left off the figure to improve clarity. Scale bar 5 μm. Red outline on bars represents bleomycin treated conditions. (C) Nuclear fractionation and western blotting after treatment with bleomycin demonstrates greater nuclear γH2AX levels in αSyn KO cells compared to WT (γH2AX levels normalized to total protein levels using REVERT stain, not shown, A.U.): WT vehicle γH2AX = 0.0074 ± 0.014, WT bleo = 0.0274 ± 0.024, αSyn KO vehicle = 0.0168 ± 0.101, αSyn KO bleo = 0.0737 ± 0.036; N = 3 biological replicates, F(3, 20) = 125.52, p < 0.0001, ANOVA, post-hoc Tukey test: WT vehicle vs. WT bleo p = 0.0002, WT vehicle vs. αSyn KO vehicle p = 0.0867, WT vehicle vs. αSyn KO bleo p < 0.0001, WT bleo vs. αSyn KO vehicle p = 0.0447, WT bleo vs. αSyn KO bleo p < 0.0001, αSyn KO vehicle vs. αSyn KO bleo p < 0.0001. Several significance lines have been left off the figure to improve clarity. Red outline on bars represents bleomycin treated conditions. (D) Neutral comet assay analysis of recovery after removal of bleomycin shows delayed DSB repair in αSyn KO cells compared to WT (mean % DNA in tail 15 min after bleo removal: WT = 1.079 ± 0.026 N = 3 biological replicates, αSyn KO = 1.285 ± 0.027 N = 3 biological replicates; unpaired t-test p = 0.0052).

