Figure 6.
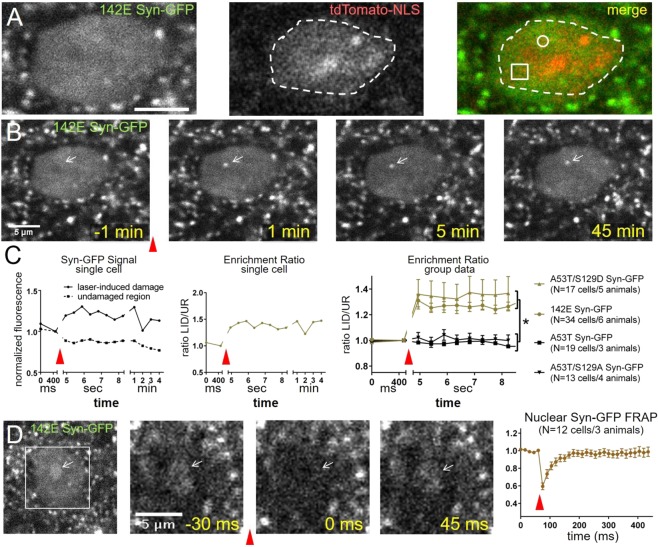
Nuclear alpha-synuclein is rapidly recruited to sites of laser-induced DNA damage in vivo. (A) Cortical neuron cell body imaged in vivo in a mouse expressing 142E Syn-GFP (heterozygous) and nuclear localized TdTomato-NLS (heterozygous). White circle in merge image shows targeting of laser-induced damage (LID) pulse and white square is the control region. Dotted line represents the outline of the nucleus. Scale bar 5 μm. (B) Baseline (t = −1min) and after LID (t = 1 min) images show accumulation of Syn-GFP at DNA damage site (white arrow). (C) Data from B) shows increased (at LID site) and decreased (at adjacent site, square in A) Syn-GFP level, calculated enrichment ratio at LID site, and group data from different transgenic (142E Syn-GFP & A53T Syn-GFP) and AAV8-mediated expression (A53T/S129D Syn-GFP & A53T/S129A Syn-GFP) animals (142E Syn-GFP Enrichment Ratio = 1.26 ± 0.03, N = 34 cells/6 animals, A53T Syn-GFP Enrichment Ratio = 0.95 ± 0.02, N = 19 cells/3 animals, A53T/S129D Syn-GFP Enrichment Ratio = 1.37 ± 0.13, N = 17 cells/5 animals, A53T/S129A Syn-GFP Enrichment Ratio = 1.00 ± 0.04, N = 13 cells/4 animals; F(3, 78) = 9.086, p = 0.0001, ANOVA, post-hoc Tukey tests: A53T/S129D vs. A53T p = 0.0002, A53T/S129D vs. A53T/S129A p = 0.0051, 142E vs. A53T p = 0.0016, 142E vs. A53T/S129A p = 0.0343, A53T/S129D vs. 142E p = 0.6078, A53T vs. A53T/S129A p = 0.9726). (D) White square shows area magnified to the right. FRAP shows rapid mobility of Syn-GFP within LID site (white arrow, τrecovery = 33.1 ms, 95% CI = 23.8–54.4 ms, N = 12 cells/3 animals). Red arrowheads in all sections show time of LID or FRAP laser pulse.

