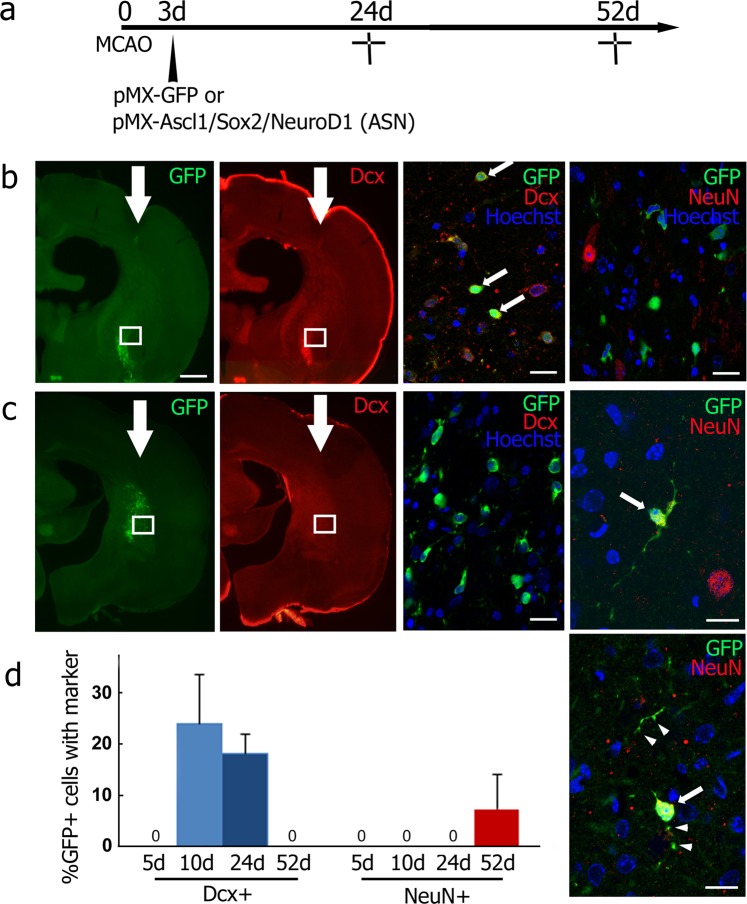
Figure 4.
(a) Experimental schedule, and double immunofluorescent analysis in the ipsilateral striatum of the pMX-ASN group for GFP/Dcx or GFP/NeuN at 24 d (b) and 52 d (c) after tMCAO. High-power images of GFP/Dcx double-positive cells (arrows in b). Some GFP/NeuN double-positive cells (arrows in c) showing synapse-like structures (arrowheads). The boxed area in (b,c) indicates the field shown in each right panel. (d) Percentage of neuronal conversion in GFP-positive cells 5 d, 10 d, 24 d and 52 d after tMCAO.

