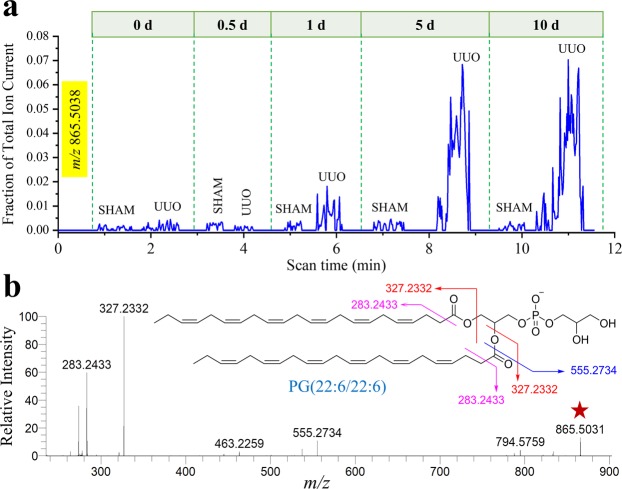
Figure 3.
Identifying the potential lipid marker for UUO. (a) Extracted ion chronogram of m/z 865.5038 (normalized with the total ion abundance) over sequential scribble scanning by DESI-MS of representative five pairs (sham control and UUO) of kidney tissue specimens at five different time points. (b) Collision-induced dissociation (CID) of m/z 865.5038 (Table S1), marked with a red star, identifies the species as PG(22:6/22:6). Inset of B shows the gas-phase fragmentation profile of the species identified.

