
Figure 7.
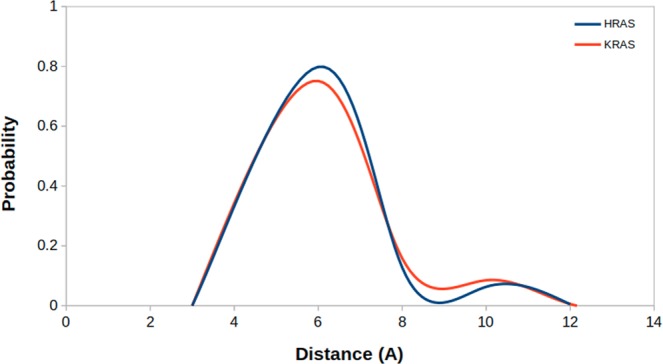
Probability plot shows distance distributions which were measured between side chain oxygen of Y32 and Pβ atom of GTP in H-RASG12D and K-RAS4BG12D mutants.
Official websites use .gov
A
.gov website belongs to an official
government organization in the United States.
Secure .gov websites use HTTPS
A lock (
) or https:// means you've safely
connected to the .gov website. Share sensitive
information only on official, secure websites.
Probability plot shows distance distributions which were measured between side chain oxygen of Y32 and Pβ atom of GTP in H-RASG12D and K-RAS4BG12D mutants.