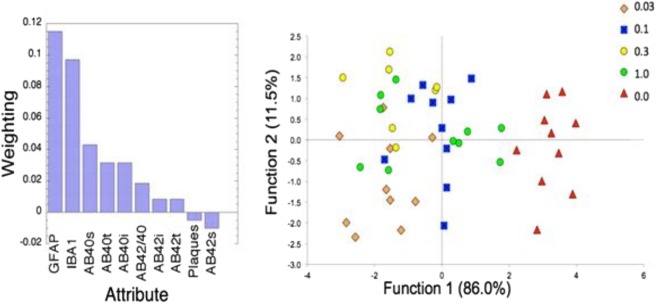
Figure 7.
Machine learning effect size analyses of data. (Left) Rankings of parameters determined from a Relief-F algorithm (s = soluble; t = total; i = insoluble). GFAP had the highest weighting followed by Iba1. (Right) Linear discriminant analysis using the top two parameters (GFAP, Iba1) and Aβ40s and Aβ40/42 by fingolimod dose (Wilk’s lambda = 0.169; p < 0.0001 for function 1, 0.769, p < 0.006 for function 2). The largest average distance from control was for the 0.03 mg/kg/day dose of fingolimod.

