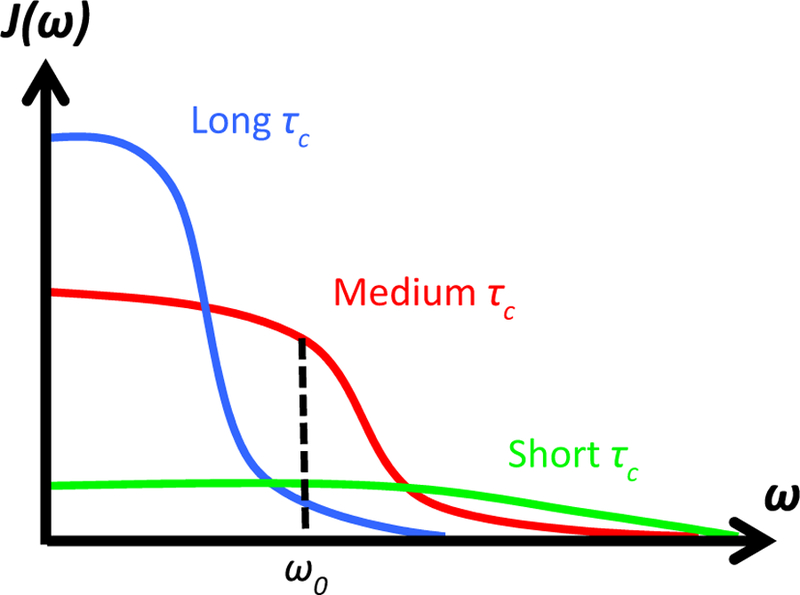
Fig. 10.

Frequency spectral density, J(ω), as a function of resonance frequency, ω, for different correlation times, τc. The longitudinal relaxation time T1 is proportional to the number of protons that are tumbling at the Larmor frequency, ω0. Pure water has a wide flat spectrum with relatively little energy around the Larmor frequency. This is also true for water molecules bound to large slow-moving macromolecules, which have a narrow spectrum. The largest contribution to T1 come from water bound to intermediate-sized molecules. From Chapter 15 in Theory and Applications of Heat Transfer in Humans. Henrik Odéen and Dennis L Parker, Non-Invasive Thermometry with Magnetic Resonance Imaging. Devashish Shrivastava (Editor). John Wiley and Sons 2018. Reprinted with permission.
