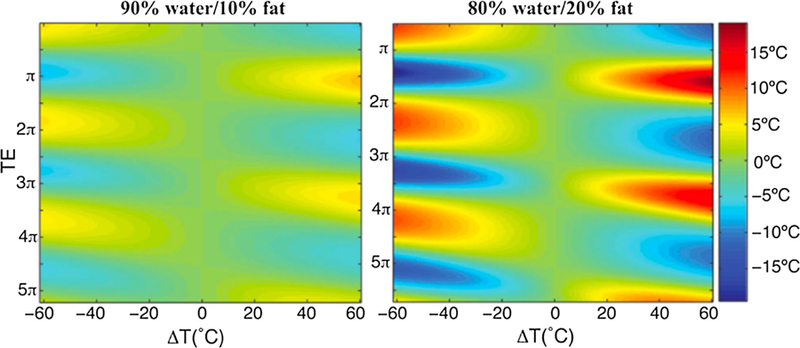
Fig. 4.

Temperature error for temperature changes from –60 to 60 °C as a function of echo time, expressed in terms of the phase angle between water and fat. Left image shows the absolute temperature error for a mixture of 90% water and 10% fat, and the right image for a mixture of 80% water and 20% fat. From ‘‘Echo Combination to Reduce Proton Resonance Frequency (PRF) Thermometry Errors From Fat” Viola Rieke and Kim Butts Pauly. Journal of Magnetic Resonance Imaging 27:673–677 (2008). Fig. 2. Reprinted with permission.
