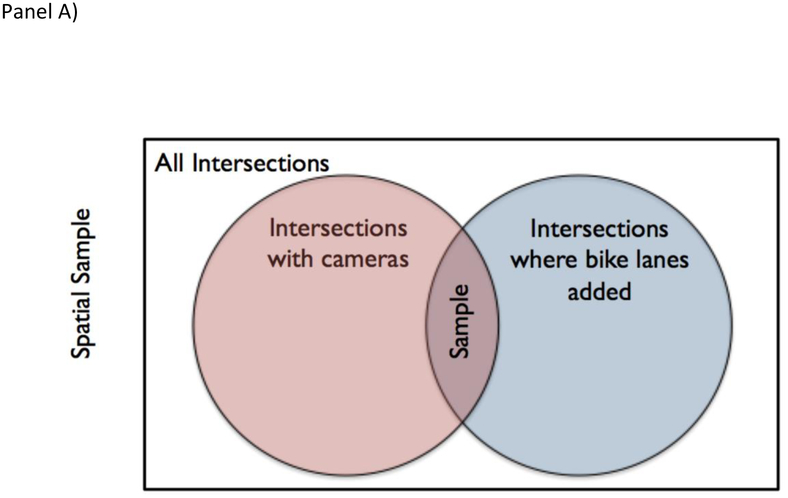
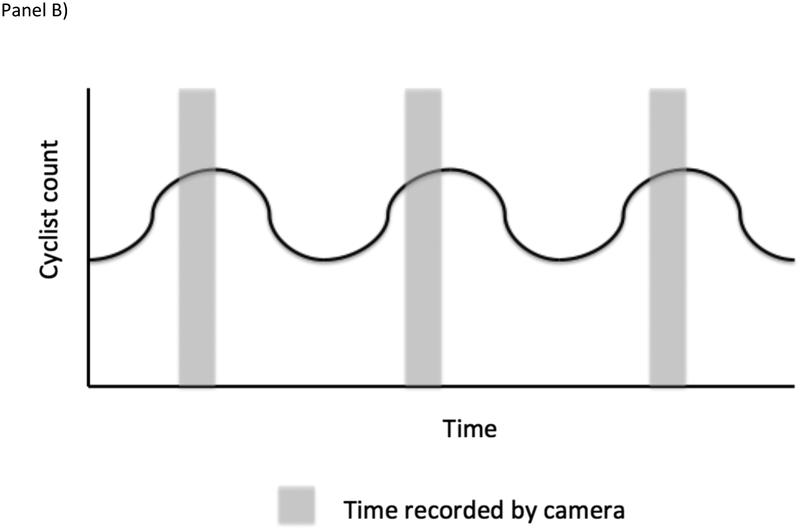
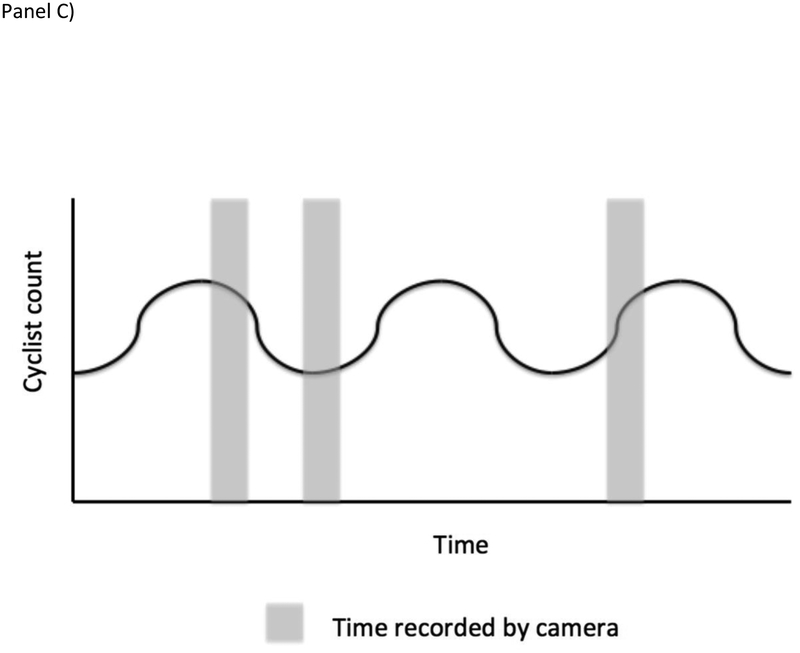
Figure 2.
Spatial and temporal sampling issues that can arise in administrative data (as in Case Study #3). Panel A is a Venn Diagram displaying conceptually how intersections were selected to be included in data collection. As discussed in the main text, treating the target population as only intersections where bike lanes were added is both conceptually appropriate and minimizes the need to account for a sampling process that cannot easily be reverse engineered. Panels B and C illustrates the potential impacts of temporal sampling in one location with a periodic change in cyclist counts. In Panel B, time sampling is systematic and synchronized with the period change in cyclist count resulting in an overestimate of the count of cyclists over time. In Panel C, sampling is random, avoiding the systematic over-count.


