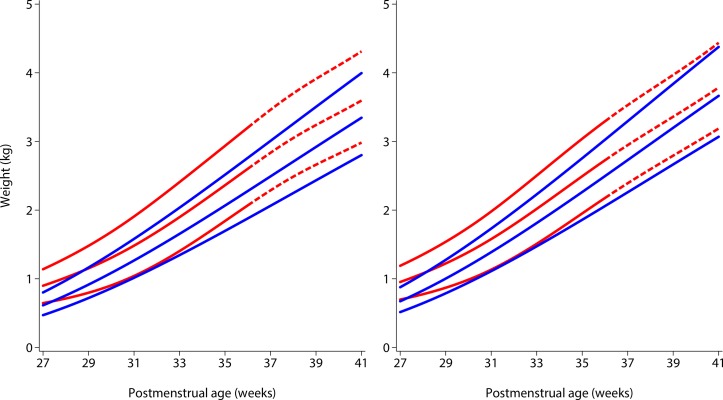
Figure 1.
Comparison of 10th, 50th and 90th centiles of the INTERGROWTH-21st Preterm Postnatal Growth Standards for weight8 (solid blue lines) with the Fenton size at birth charts26 (solid and dashed red lines) according to sex (left, girls; right, boys) from 27+0 to 40+6 postmenstrual weeks. The dashed red lines correspond to the gestational ages at which the Fenton charts were modelled to reach the WHO Child Growth Standards at 50 weeks (figure modified from Villar et al 10).

