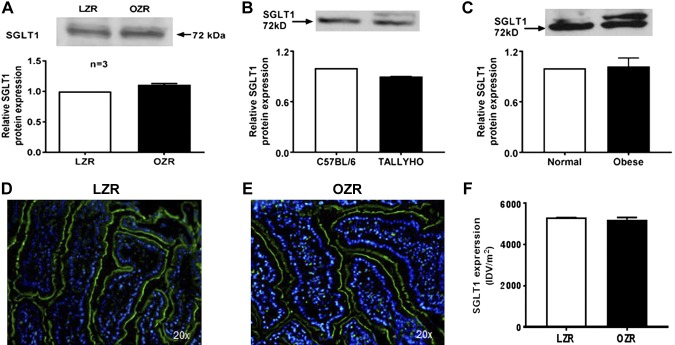
Figure 2.
Effect of obesity on SGLT1 protein. A–C) Western blot analysis showed that villus-cell SGLT1 protein levels remained unchanged in BBM between OZRs and LZRs (A), TOM and C57BL/6 (B), and obese and normal humans (C). D–F) Immunofluorescence studies of small-intestinal tissue sections showed that SGLT1 immunofluorescence (green) with DAPI nuclear stain (blue) merged in LZRs (D) is unchanged in OZRs (E) and densitometric quantification of both (F) showed no change as well. In A–C, the upper panel is a representative Western blot experiment performed at least 3 times and quantitated in the lower panels. A representative experimental pictograph is shown in D and E, and quantitation of 5 such experiments is shown in F.

