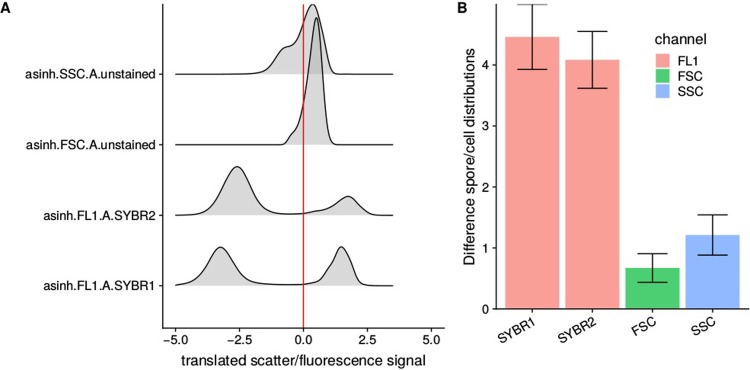
Fig 2. Comparison of different dyes and channels used for optimal separation of cells and spores (time = 30 minutes, concentration = 2 fold).
(A) Raw data and cutoff values based on GMM. X-axis shows translated signal, so that the threshold is always at 0. (B) Distance between normal distributions as predicted by GMM in the respective channels with error bars showing the pooled standard deviation. The same metric was used to evaluate the effect of staining time, stain concentration (S1 Fig).

