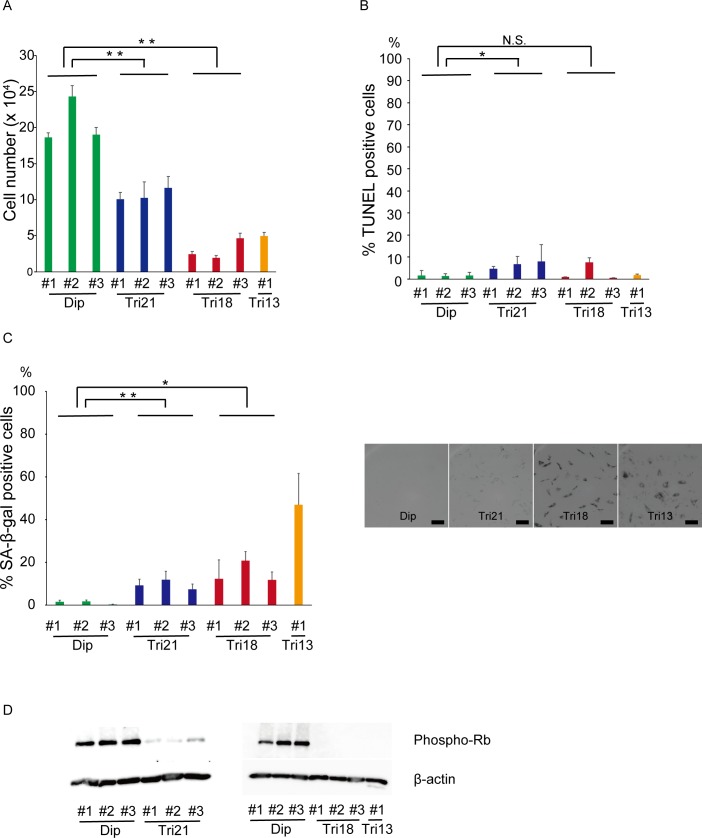
Fig 1. Trisomy fibroblasts showed severe proliferative impairment owing to premature senescence.
(A) Absolute cell numbers three days after seeding 3×10⁴ cells (n = 3 per cell line). **P < 0.01. Dip, diploid; Tri, trisomy. (B) Percentage of TUNEL-positive cells (n = 3–7 per cell line). *P < 0.05. Dip, diploid; Tri, trisomy; N.S., not significant. (C) Percentage of SA-β-gal-positive cells (n = 3 per cell line). The right panel shows representative phase contrast images. Bar = 100 μm. **P < 0.01; *P < 0.05. Dip, diploid; Tri, trisomy. (D) Expression of phospho-Rb by western blotting analysis. Comparisons were made by Student’s t-test or Welch’s two-sample t-test.

