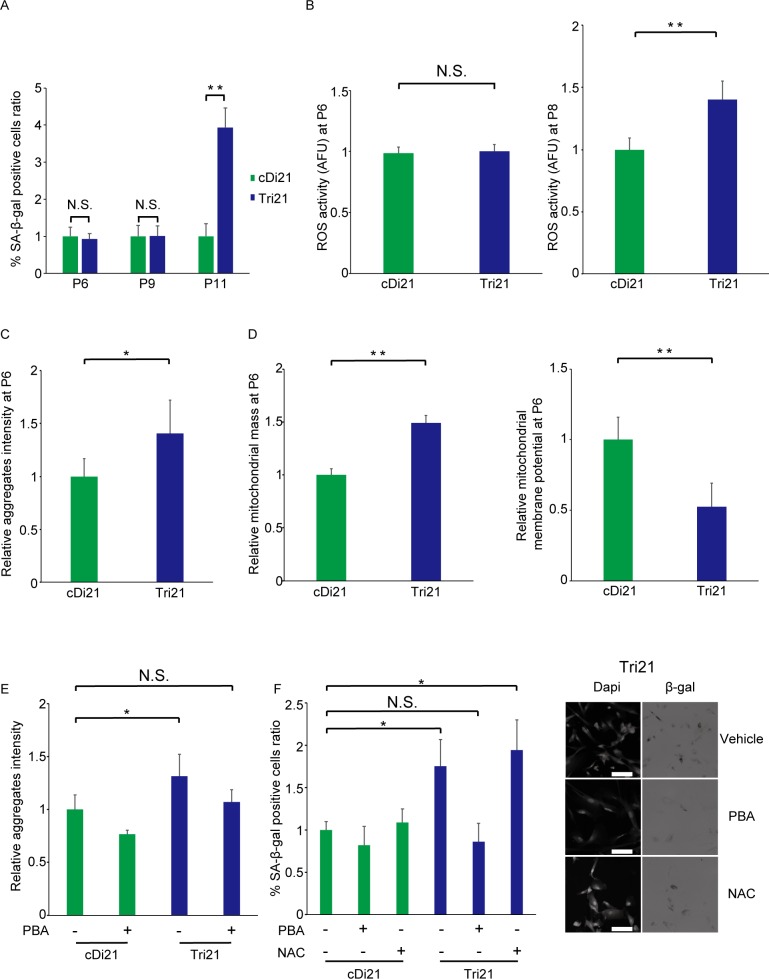
Fig 6. Rescue of trisomy-induced premature senescence by 4-PBA treatment in trisomy 21 iPSC-derived secondary fibroblasts.
(A) Percentage of SA-β-gal-positive cells (n = 3 per cell line). **P < 0.01. cDi21, corrected disomy 21 iPSC-derived secondary fibroblasts; Tri21, trisomy 21 iPSC-derived secondary fibroblasts; N.S., not significant. (B) Relative ROS production as expressed by relative MitoSOX/MitoTracker ratio at passage 6 (left) and passage 8 (right) (n = 6 per cell line). **P < 0.01. cDi21, corrected disomy 21 iPSC-derived secondary fibroblasts; Tri21, trisomy 21 iPSC-derived secondary fibroblasts; N.S., not significant. (C) Accumulation of aggregated proteins, as detected by the PROTEOSTAT Aggresome Detection kit (n = 6 per cell line). *P < 0.05. cDi21, corrected disomy 21 iPSC-derived secondary fibroblasts; Tri21, trisomy 21 iPSC-derived secondary fibroblasts. (D) The left panel shows relative mitochondrial mass per cell as assessed by the mean MitoTracker Red CMXRos-positive area per cell. The right panel shows relative mitochondrial membrane potential per cell (n = 6 per cell line). **P < 0.01. cDi21, corrected disomy 21 iPSC-derived secondary fibroblasts; Tri21, trisomy 21 iPSC-derived secondary fibroblasts. (E) Effects of 4-PBA on aggregated protein accumulation (n = 5 per cell line). *P < 0.05. PBA, sodium phenylbutyrate; cDi21, corrected disomy 21 iPSC-derived secondary fibroblasts; Tri21, trisomy 21 iPSC-derived secondary fibroblasts; N.S., not significant. (F) Effects of 4-PBA (2 mM) or NAC (2.5 mM) on cellular senescence. The right panel shows representative phase contrast images. Bar = 100 μm. The left panel shows corresponding quantification (n = 3 per cell line). *P < 0.05. PBA, sodium phenylbutyrate; NAC, N-acetyl-L-cysteine; cDi21, corrected disomy 21 iPSC-derived secondary fibroblasts; Tri21, trisomy 21 iPSC-derived secondary fibroblasts; N.S., not significant.

