
Figure 3. SorCS1 region on VVU15.
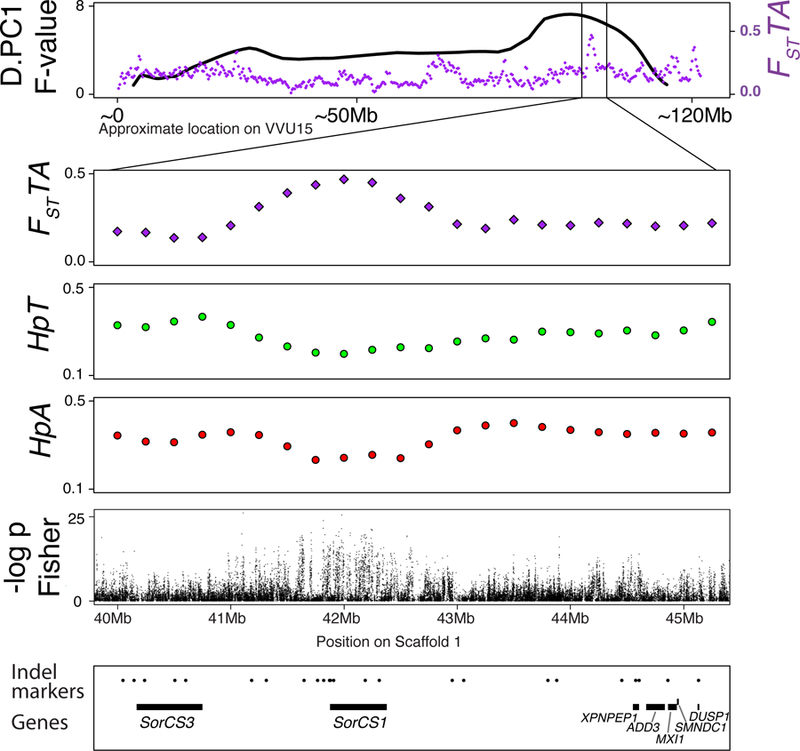
The top panel represents the QTL plot for D.PC1 (black line) and the distribution of FST values (purple) between the tame and aggressive populations. The position on VVU15 is approximated by adding the lengths of the portions of the scaffolds that mapped to the syntenic dog chromosomes (CFA31, CFA28). The three lower panels show the FST and Hp values on fox scaffold 1: 40–45Mb, the segment that maps to the region on VVU15 (CFA28 segment) that has the QTL for D.PC1 and a significant hit for FST between the tame and aggressive populations. The fifth panel shows the results of the Fisher exact tests for allele frequency differences between the tame and aggressive populations conducted using individual SNPs. The x-axis is the –log10 transformed unadjusted p-values. The bottom panel shows the positions of the genes in the region (black lines) and all genotyped markers (black dots).