
Figure 4. The SorCS1-associated haplotypes and their effect on behavior in the F2 population.
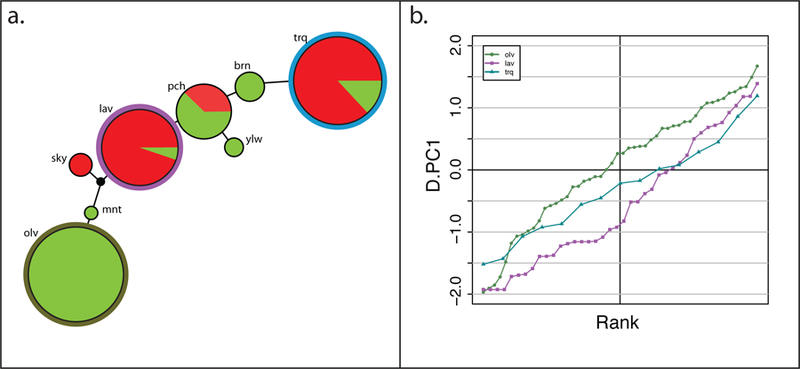
a. A network of the SorCS1 associated haplotypes in the tame and aggressive populations. The size of the circles is scaled relative to the frequency of the haplotype in both populations combined, and the center of the circle is colored to show the relative frequencies of the haplotype in either population (tame being green and aggressive being red). The outer circle of the three major haplotypes (olv, trq, and lav) are colored as in panel b. The length of the lines between the haplotypes is scaled relative to the number of genotypes for individual markers that differ between the haplotypes, ranging from 1–3. The black node is the calculated median vector from the Network 5 run. b. Cumulative distributions of the scores for the behavioral phenotype D.PC1 among F2 individuals homozygous for the three main haplotypes: olv, lav, and trq. The primary tame haplotype, olv, is shown in olive green, and the most common aggressive haplotypes, lav and trq, are shown in purple and blue, respectively. The points on the lines are individual F2 foxes.