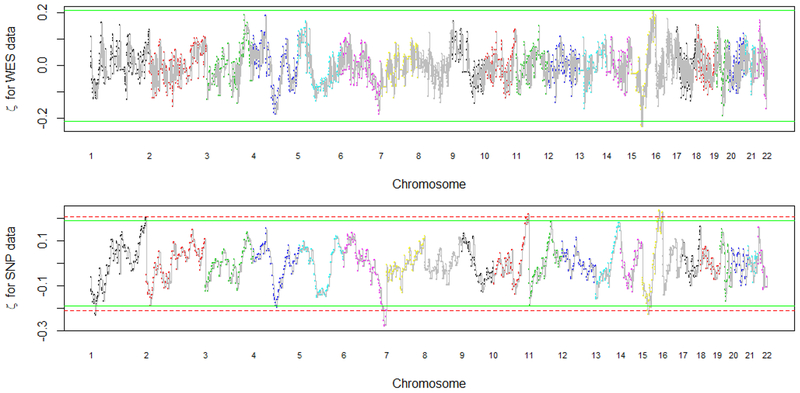
Figure 5.
The estimated η values using the WES data and the SNP data. The dashed and solid line are the cutoff values for controlling the false discovery rate at 10% and 20%, respectively. Multiple locations of CNVs are identified to be associated with the platinum resistant status, with more locations being identified using the SNP data. For example, the regions at 4q22, 6q26, and 15q26 are significant at a false discovery level of 20% for both WES and SNP data. This figure appears in color in the electronic version of this article.

