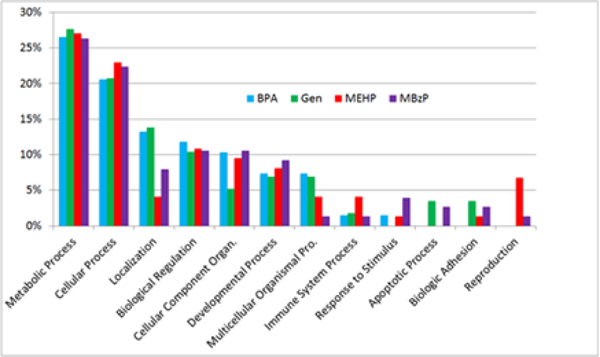
Figure 1.

Bar graph representation of proteins classified by biological function. Analysis was carried out via PANTHER on differentially regulated proteins identified via TMT-MS from blood of prepubertal girls with high urine concentrations of BPA genistein, MEHP and MBzP
