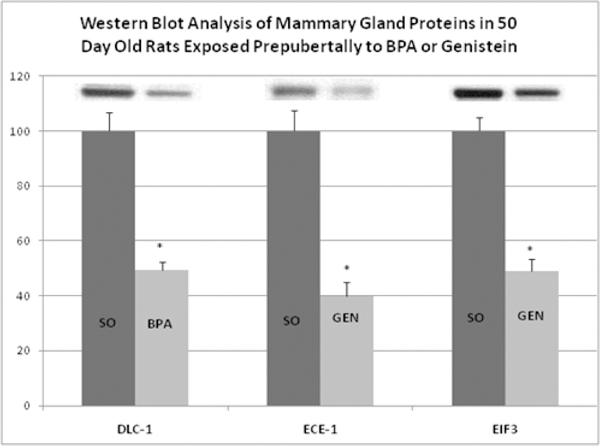
Figure 2.

Western blot analysis of DLC-1, ECE-1 and EIF3 in the mammary glands of PND50 rats exposed prepubertally via lactation to control (SO), BPA or genistein (GEN). Panel A. Quantification is reported as the percent of control with densitometry values for controls set to 100. Values represent mean density ±SEM as a percent of the control group (n=6 per group).Asterisk (*) indicates statistically significant difference in detected protein abundance compared to control (p<0.00l). Inserts are representative immuno-blots of 40μg of serum protein from the SO and BPA- or GEN-treated groups.
