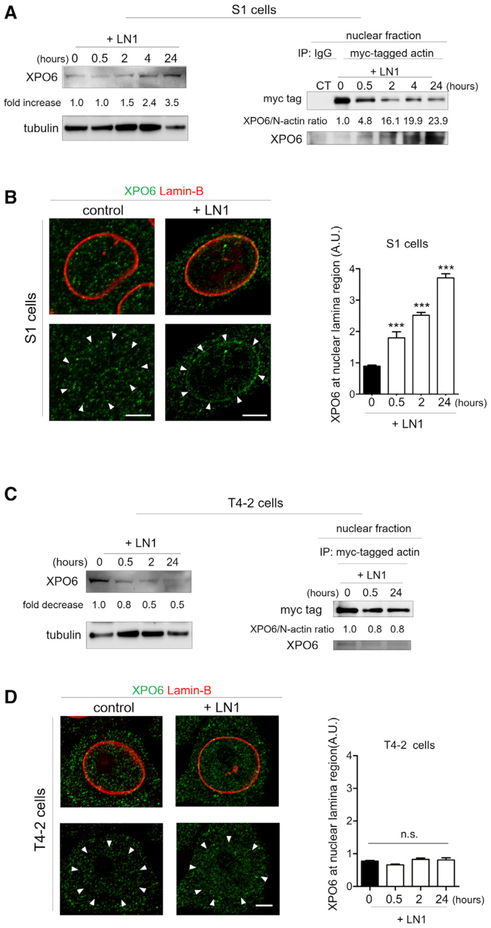
Figure 4. LN1 Changes the Ratio of XPO6 to N-Actin in Opposite Directions in Nonmalignant and Malignant Cells.
(A) Left: western blot of total S1 cell lysate showing the changes in XPO6 content after addition of LN1 (three independent experiments). Tubulin was used as a loading control. Right: co-immunoprecipitation of myc-tagged actin reveals actin interaction with XPO6 in the nuclear fraction of S1 cells after LN1 treatment (two independent experiments). In nonmalignant cells, LN1 increases both XPO6 expression and the XPO6 to N-actin ratio (normalization of XPO6 levels to myc-tagged actin) in the co-immunoprecipitation pellet (see also Figure S3D).
(B) Left: representative images of cells stained for XPO6 (green) and lamin-B (red) showing an increase in localization of XPO6 at the nuclear lamina (NL) region after LN1 treatment. Arrowheads denote the localization of the nuclear lamina based on lamin-B staining (above). Right: quantification of the fluorescence intensity of XPO6 detected at the nuclear lamina region (10 cells assayed/time point from three independent experiments).
(C) LN1 reduces both XPO6 expression and its interaction with N-actin in malignant cells. Left: western blot of total T4-2-cell lysate showing the decrease of XPO6 after LN1 treatment. Tubulin was used as a loading control. Right: co-immunoprecipitation of myc-tagged actin revealing actin interaction with XPO6 in the nuclear fraction of T4-2 cells after LN1 treatment.
(D) The distribution of XPO6 remains unchanged in T4-2 cells after LN1 treatment. Left: Representative images of IF showing the localization of the XPO6 in T4-2 cells. Right: quantification of XPO6 at the nuclear lamina region of T4-2 cells (10 cells assayed/time point from three independent experiments).
Data are expressed as mean ± SEM. ***p < 0.0001; n.s., no statistical significance. Scale bars, 5 μm.

