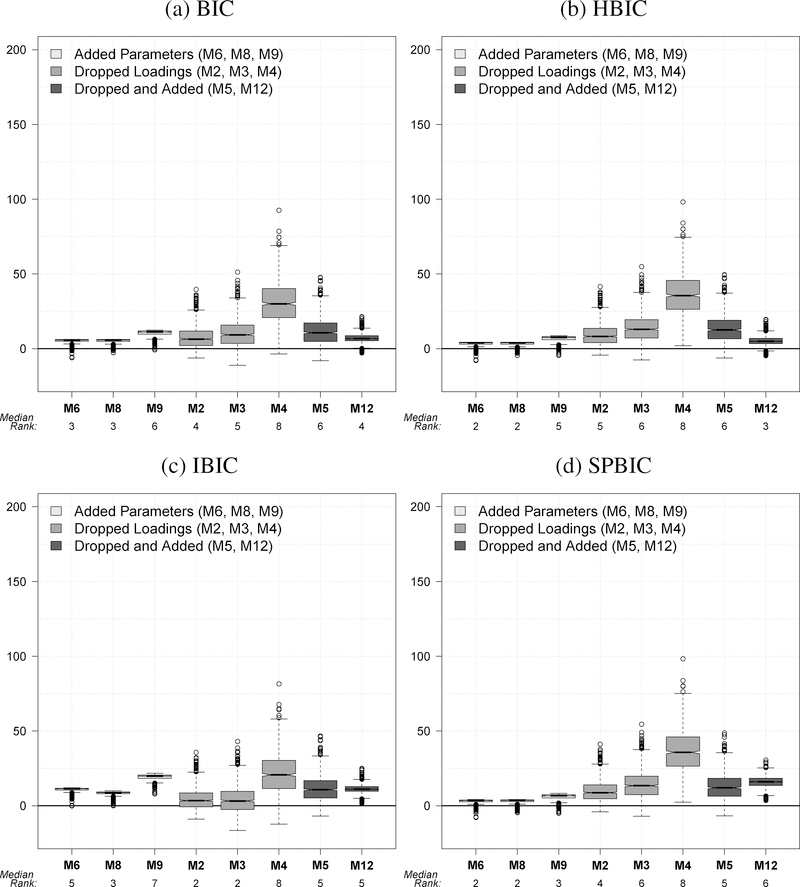
Figure 5:
SIM1 IC Box-and-Whisker Plots and Median Ranks with No True Model (N = 500). Box-and-Whisker plots represent each fit statistic for each model over the 1,000 simulations. Numbers below the model names represent the median rank of each fit statistic for each model over the 1000 simulations.

