Fig.2.

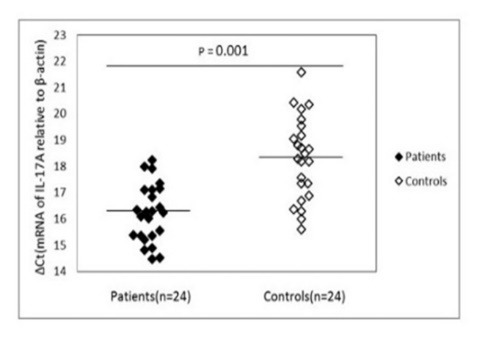
mRNA expression levels for Il-17A in patients and control subjects. β-actin was used as the internal control. Please note that a higher ΔCt value corresponds to a comparably lower expression level.

mRNA expression levels for Il-17A in patients and control subjects. β-actin was used as the internal control. Please note that a higher ΔCt value corresponds to a comparably lower expression level.