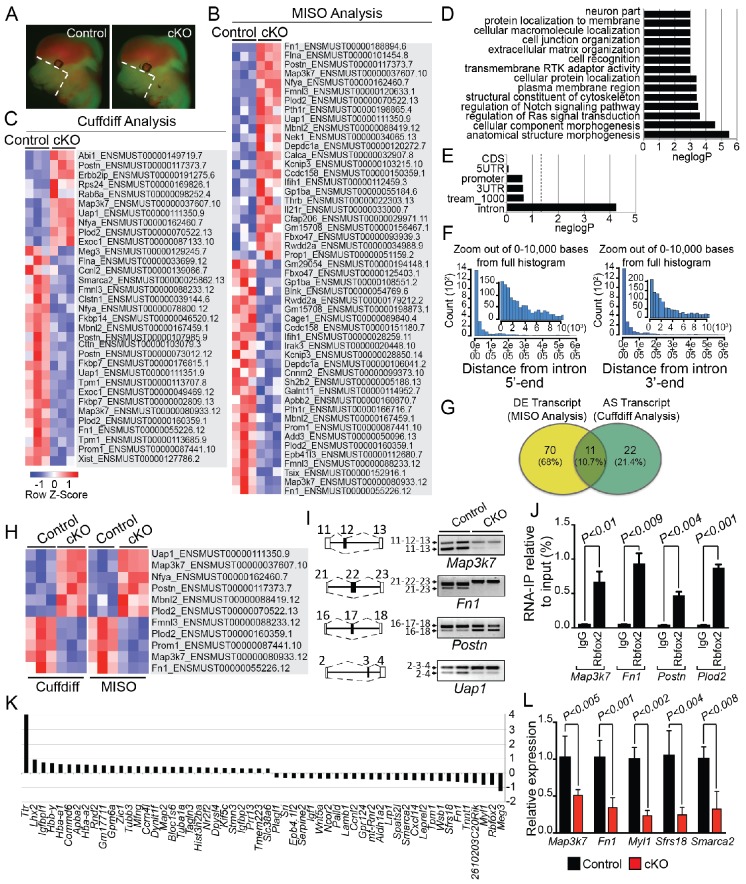
Figure 5. Rbfox2-dependent splicing and transcriptional changes in neural crest cells.
Representative fluorescent images from E12.5 control (n = 3) and Rbfox2Pax3-CKO mutant (represented as cKO, n = 3) embryos showing the area (white, dotted line) of craniofacial tissue microdissected for RNA-Seq analysis (A). Heat map of 50 differentially expressed transcripts (out of a total of 81 transcripts) identified by MISO analysis of RNA-Seq data (B). Heat map of 33 alternatively spliced transcripts identified by Cuffdiff analysis of RNA-Seq data (C). Pathway enrichment analysis of Rbfox2 target genes (D). Motif (UGCAUG) enrichment analysis. Significant enrichment was observed only in the introns of the target genes (E). Location of the intronic UGCAUG sequences in the Rbfox2 target genes (F). Venn diagram showing the overlap of transcripts identified by MISO and Cuffdiff analysis of RNA-Seq data (G). Heat map representation of 11 transcripts identified by both MISO and Cuffdiff analysis (H). RT-PCR analysis of alternative splicing of Rbfox2 targets in control and Rbfox2 mutant cranial mesenchyme from two independent replicates for each genotype (I). The gene structure, illustrating the alternative exons is presented on left. RNA-IP on palatal mesenchymal cells (J). Differentially expressed genes control and Rbfox2 mutants (K). qRT-PCR validation of differentially spliced and differentially expressed genes (L).


