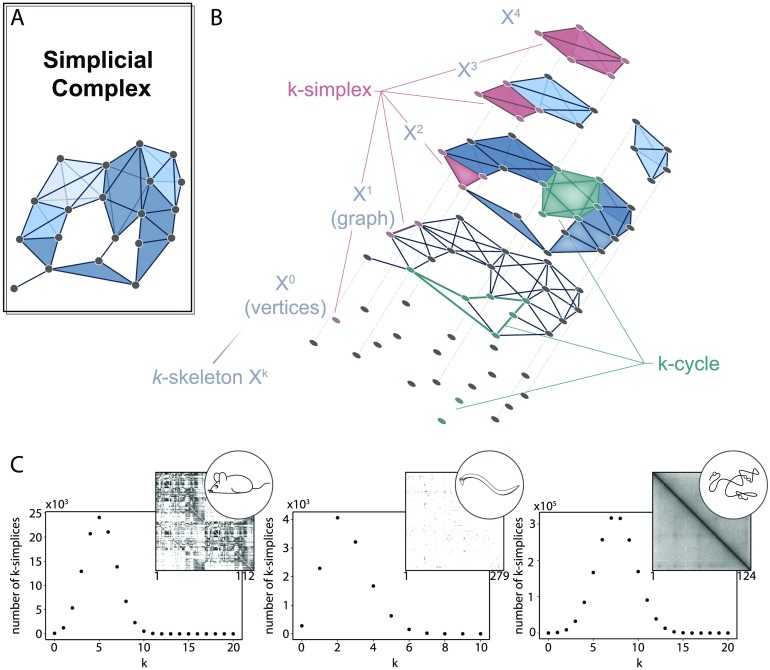
Figure 2. .
The simplicial complex. (A) A simplicial complex with simplicies colored by dimension. (B) Peering into the simplicial complex by separating it into the k-skeleta. An example k-simplex is colored in burgundy, an example k-chain is colored in salmon, and several example k-cycles are colored in teal for each dimension. (C) The distribution of k-simplices in the clique complex created from the (left) mouse interareal connectome, (middle) C. elegans electrical and chemical synapses, and (right) genomic interaction Hi-C data indicating distances between points on the linear genome. The adjacency matrix associated with each system is displayed in the upper right corner of each plot.

