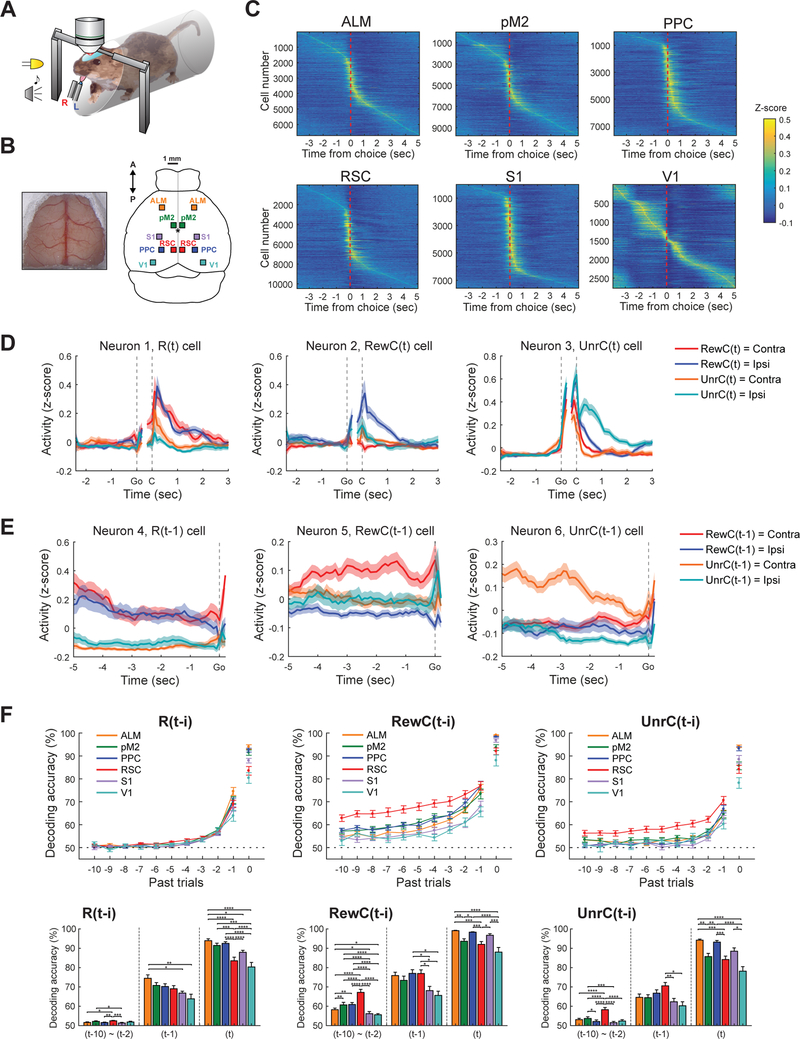
Figure 2. Area specificity of history signals in expert mice.
(A) Schematic of two-photon imaging during task performance.
(B) Large craniotomy preparation that exposes most of the dorsal cortex for optical access (left) and locations of the 6 dorsal cortical areas imaged (right). Bregma is indicated with asterisk.
(C) Z-score normalized activity aligned to choice for all neurons imaged from expert mice. High activity during pre-choice period in V1 likely reflects visual response to ready cue (LED light).
(D) The activity of 3 example neurons in RSC tuned to the reward (Neuron 1, R(t) cell), rewarded choice (Neuron 2, RewC(t)), or unrewarded choice (Neuron 3, UnrC(t)) of the current trial.
(E) The activity of 3 example neurons in RSC tuned to the reward (Neuron 4, R(t-1) cell), rewarded choice (Neuron 5, RewC(t-1)), or unrewarded choice (Neuron 6, UnrC(t-1)) of the immediately preceding (t-1) trial.
(F) Decoding accuracy for current and history information based on population activity of 200 neurons from each of the 6 cortical areas. Ready period activity (between −1.9 and −0.1 s from go cue) was used for history decoding ((t-10) to (t-1)), and post-choice period activity (between 0 and 1 s from choice) was used for current trial information decoding (t). Decoding accuracy was calculated by 10-fold cross-validation with PLS regression. Note that this analysis is potentially confounded by the autocorrelation of choice, which may inflate the length of encoded history. Thus we limit our interpretation to the differences across areas. Bar graphs show mean ± s.e.m. Two-way ANOVA with Tukey’s post-hoc test for (t-10)~(t-2), One-way ANOVA with Tukey’s post-hoc test for (t-1) and (t).
*P < 0.05, **P < 0.01, ***P < 0.001, ****P < 0.0001. All error bars are s.e.m.
See also Figure S2.

