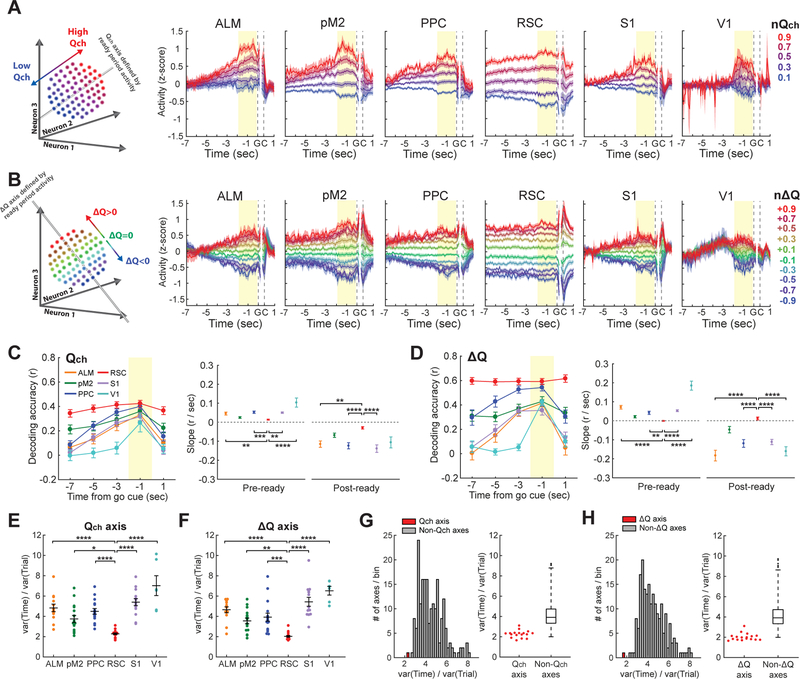
Figure 4. Persistent population encoding of value-related information in retrosplenial cortex of expert mice.
(A-B) Projection of 200-cell population activity to Qch (A) or ∆Q (B) axis defined by ready period (yellow shading) activity. Qch was normalized such that it ranged from 0 to 1 for each session. ∆Q was normalized such that the negative and positive ∆Q ranged from −1 to 0 and from 0 to 1, respectively, for each session. Trials were averaged with 0.2 bin of the normalized Qch or ∆Q. Population activity along each axis was z-score normalized before averaging across sessions.
(C-D) (Left) Performance of decoders trained on ready period activity of 200 neurons at various time points (1.9-sec bins) in a trial. (Right) Slopes of the decoding accuracy curves before (−7 to −1 s, ‘pre-ready’) or after (−1 to 1 s, ‘post-ready’) the ready period (One-way ANOVA with Tukey’s post-hoc test for linear regression coefficients. Only the comparisons between RSC and the other areas are shown. The pre-ready slope for V1 was obtained using only −3 and −1 s.). Decoding accuracy quickly decays as the window moves away from ready period except for RSC, indicating value coding with persistent population activity pattern in RSC. (E-F) Temporal activity variance normalized by across-trial activity variance along Qch axis (E) or ∆Q axis (F) for 200-cell population from 6 cortical areas (One-way ANOVA with Tukey’s post-hoc test. Only the comparisons between RSC and the other areas are shown.). RSC shows the most persistent value coding.
(G-H) Temporal activity variance normalized by across-trial activity variance along Qch axis (G), ∆Q axis (H) or 199 axes orthogonal to either Qch or ∆Q axis for 200-cell RSC population activity. (Left) Distribution of variance along 200 axes in an example session. Qch and ∆Q axes are highlighted with red. (Right) Distributions of variance from all expert sessions. The horizontal lines of boxplots indicate medians, and the 25th and 75th percentiles. The whiskers extend to the most extreme data points, excluding outliers. The black dots indicate outliers.
*P < 0.05, **P < 0.01, ***P < 0.001, ****P < 0.0001. All error bars are s.e.m.
See also Figure S4.

